Figure 3 of
Moura, Mol Vis 2021; 27:656-xxx.
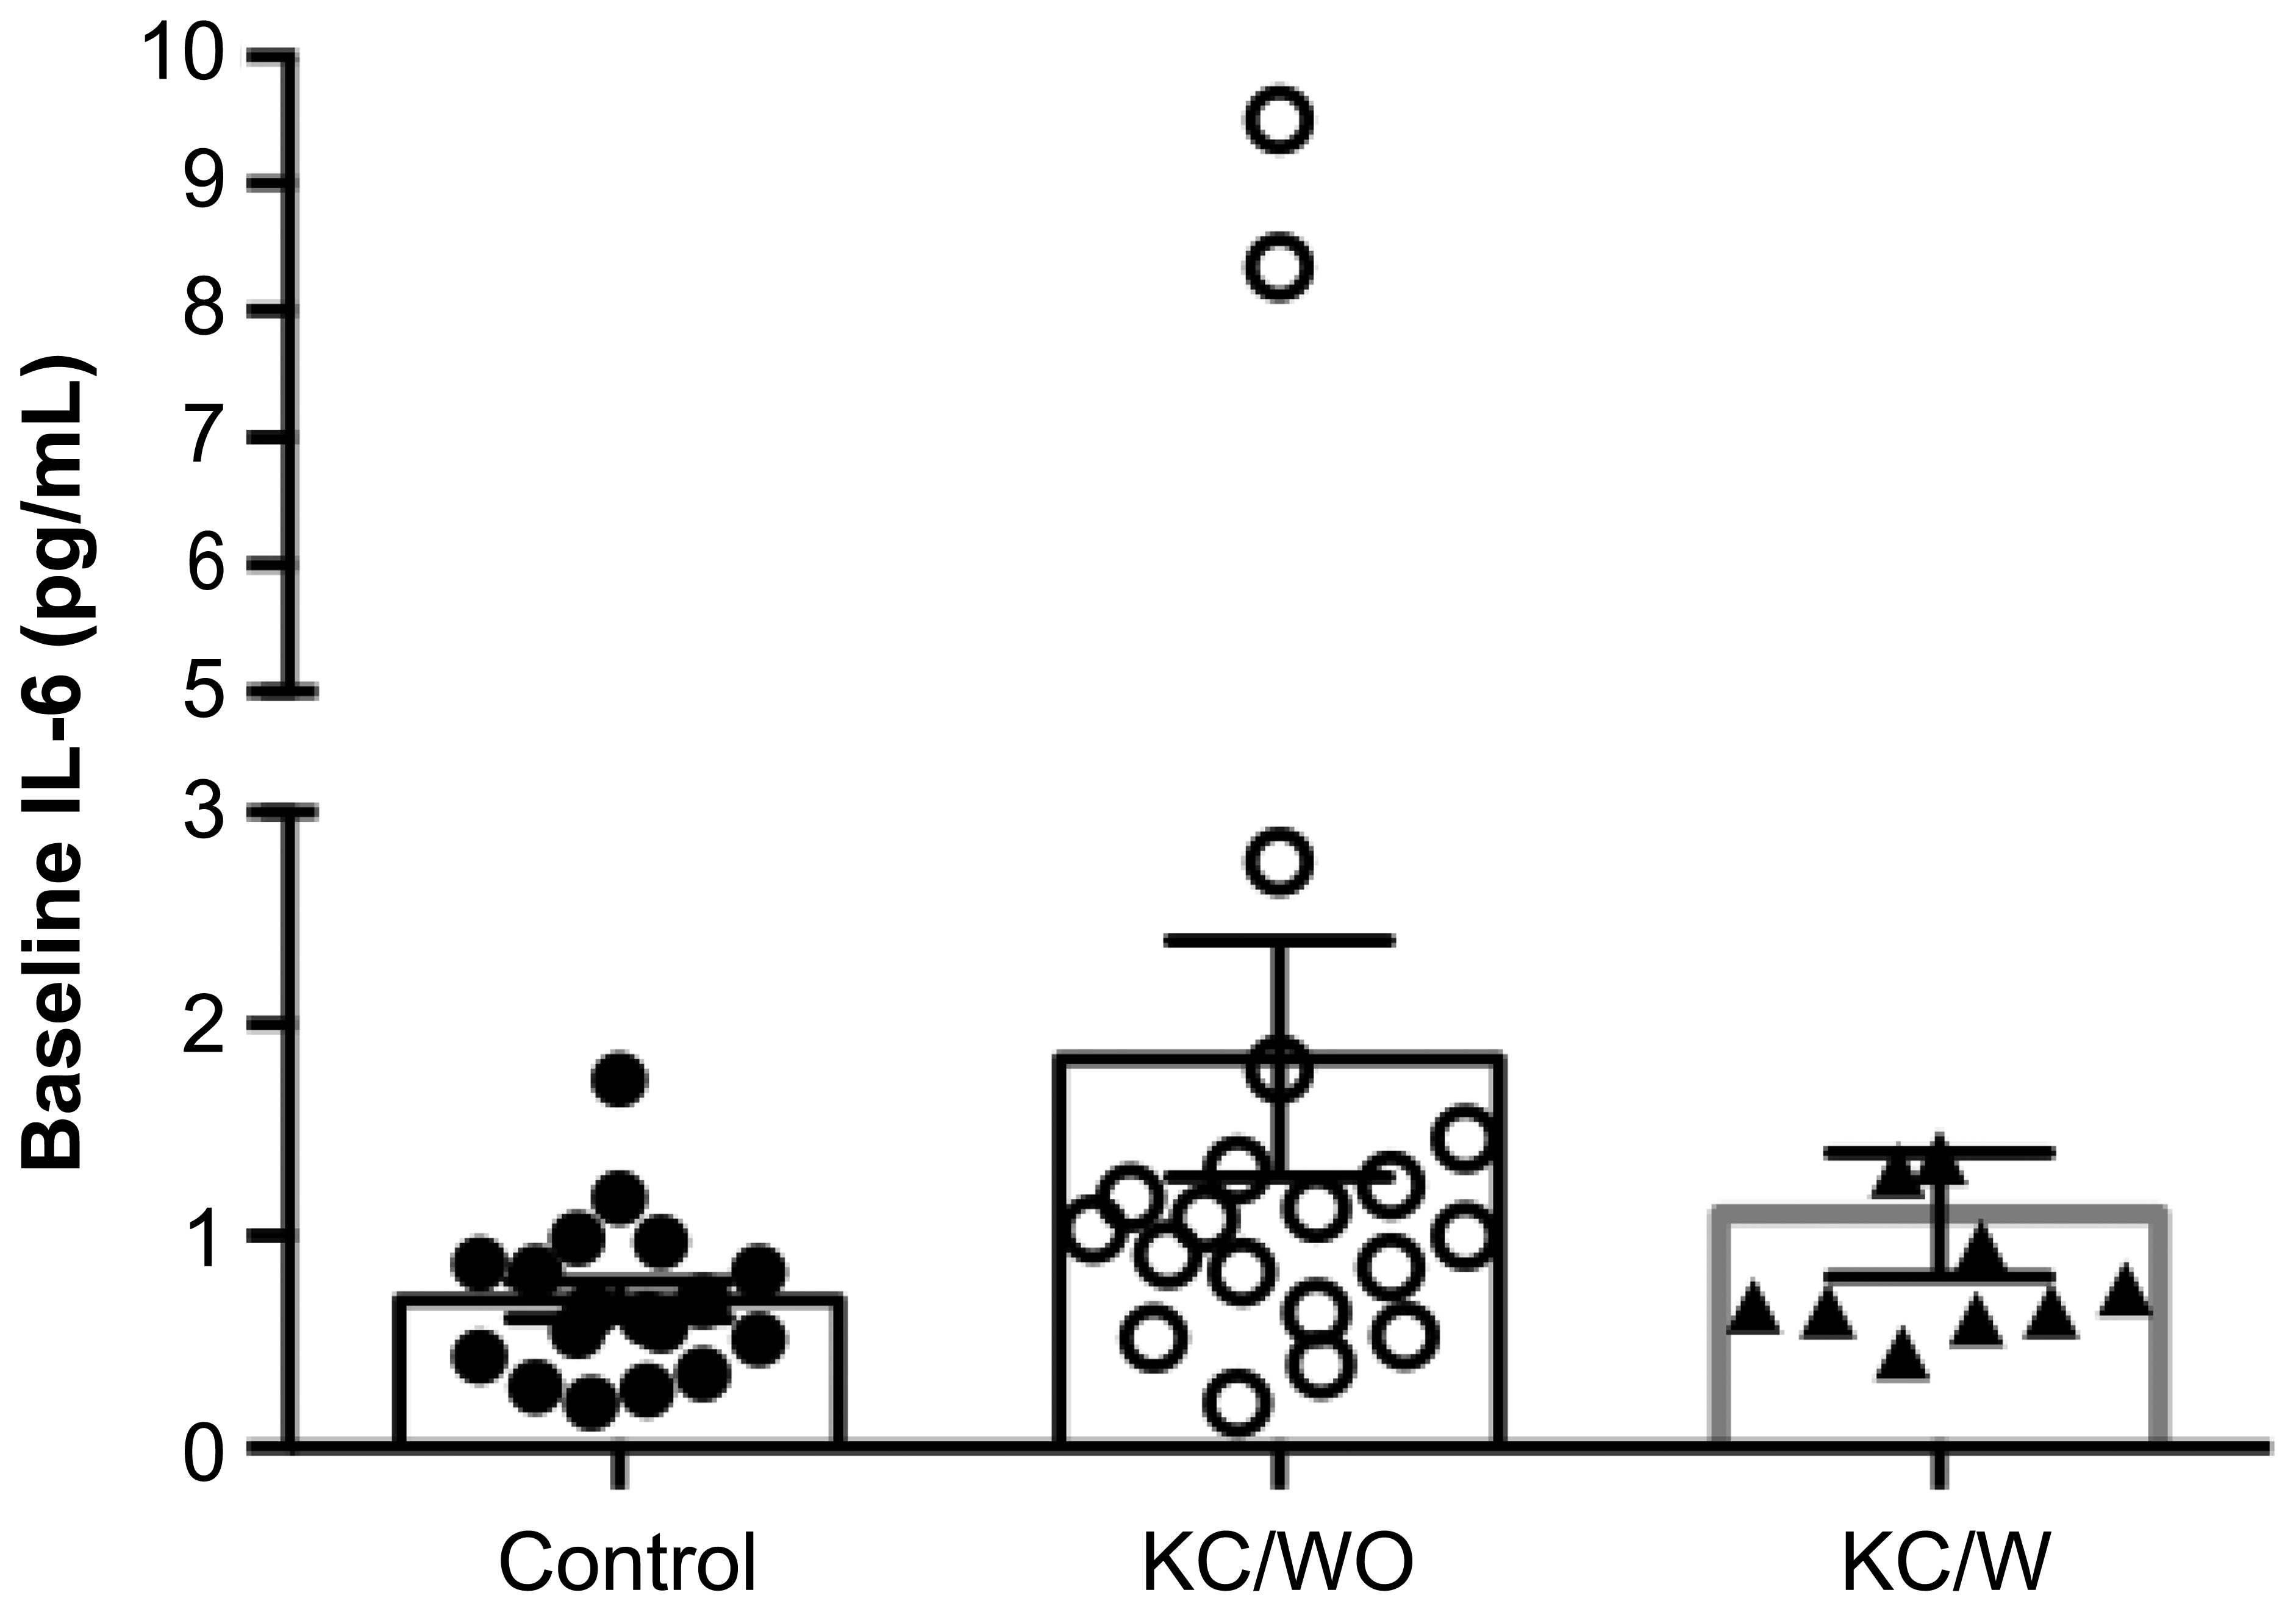
Figure 3.
IL-6 levels between control and KC groups with and without progression at baseline (p = 0.032).
 Figure 3 of
Moura, Mol Vis 2021; 27:656-xxx. Figure 3 of
Moura, Mol Vis 2021; 27:656-xxx.
Figure 3 of
Moura, Mol Vis 2021; 27:656-xxx. Figure 3 of
Moura, Mol Vis 2021; 27:656-xxx.