Figure 4. DEX exposure induces changes in global 5hmC structures. Typical stimulated emission depletion (STED) image of the 5hmC pattern
in (A) control, 1 mg/ml dexamethasone (DEX), and 2 mg/ml DEX after 48 h. B: 5hmC cluster number distribution per cell nucleus. *p<0.01 with the Mann–Whitney test. C: Violin plot of the 5hmC cluster area. D: 5hmC nearest neighbor distance (NND) distribution. E: The 5hmC density distribution is shown versus the normalized distance from the nucleus center position with 20 radial rings.
F: t-distributed stochastic neighbor embedding (t-SNE) analysis of the average 5hmC cluster features in each nucleus. G: t-SNE analysis of the grouped 5hmC cluster features in the control, 1 mg/ml DEX, and 2 mg/ml DEX after 48 h. Violin plots are
shown with 25%, median (round mark), 75%, smooth kernel curve. Data collected from 40 to 60 cells in three experiments.
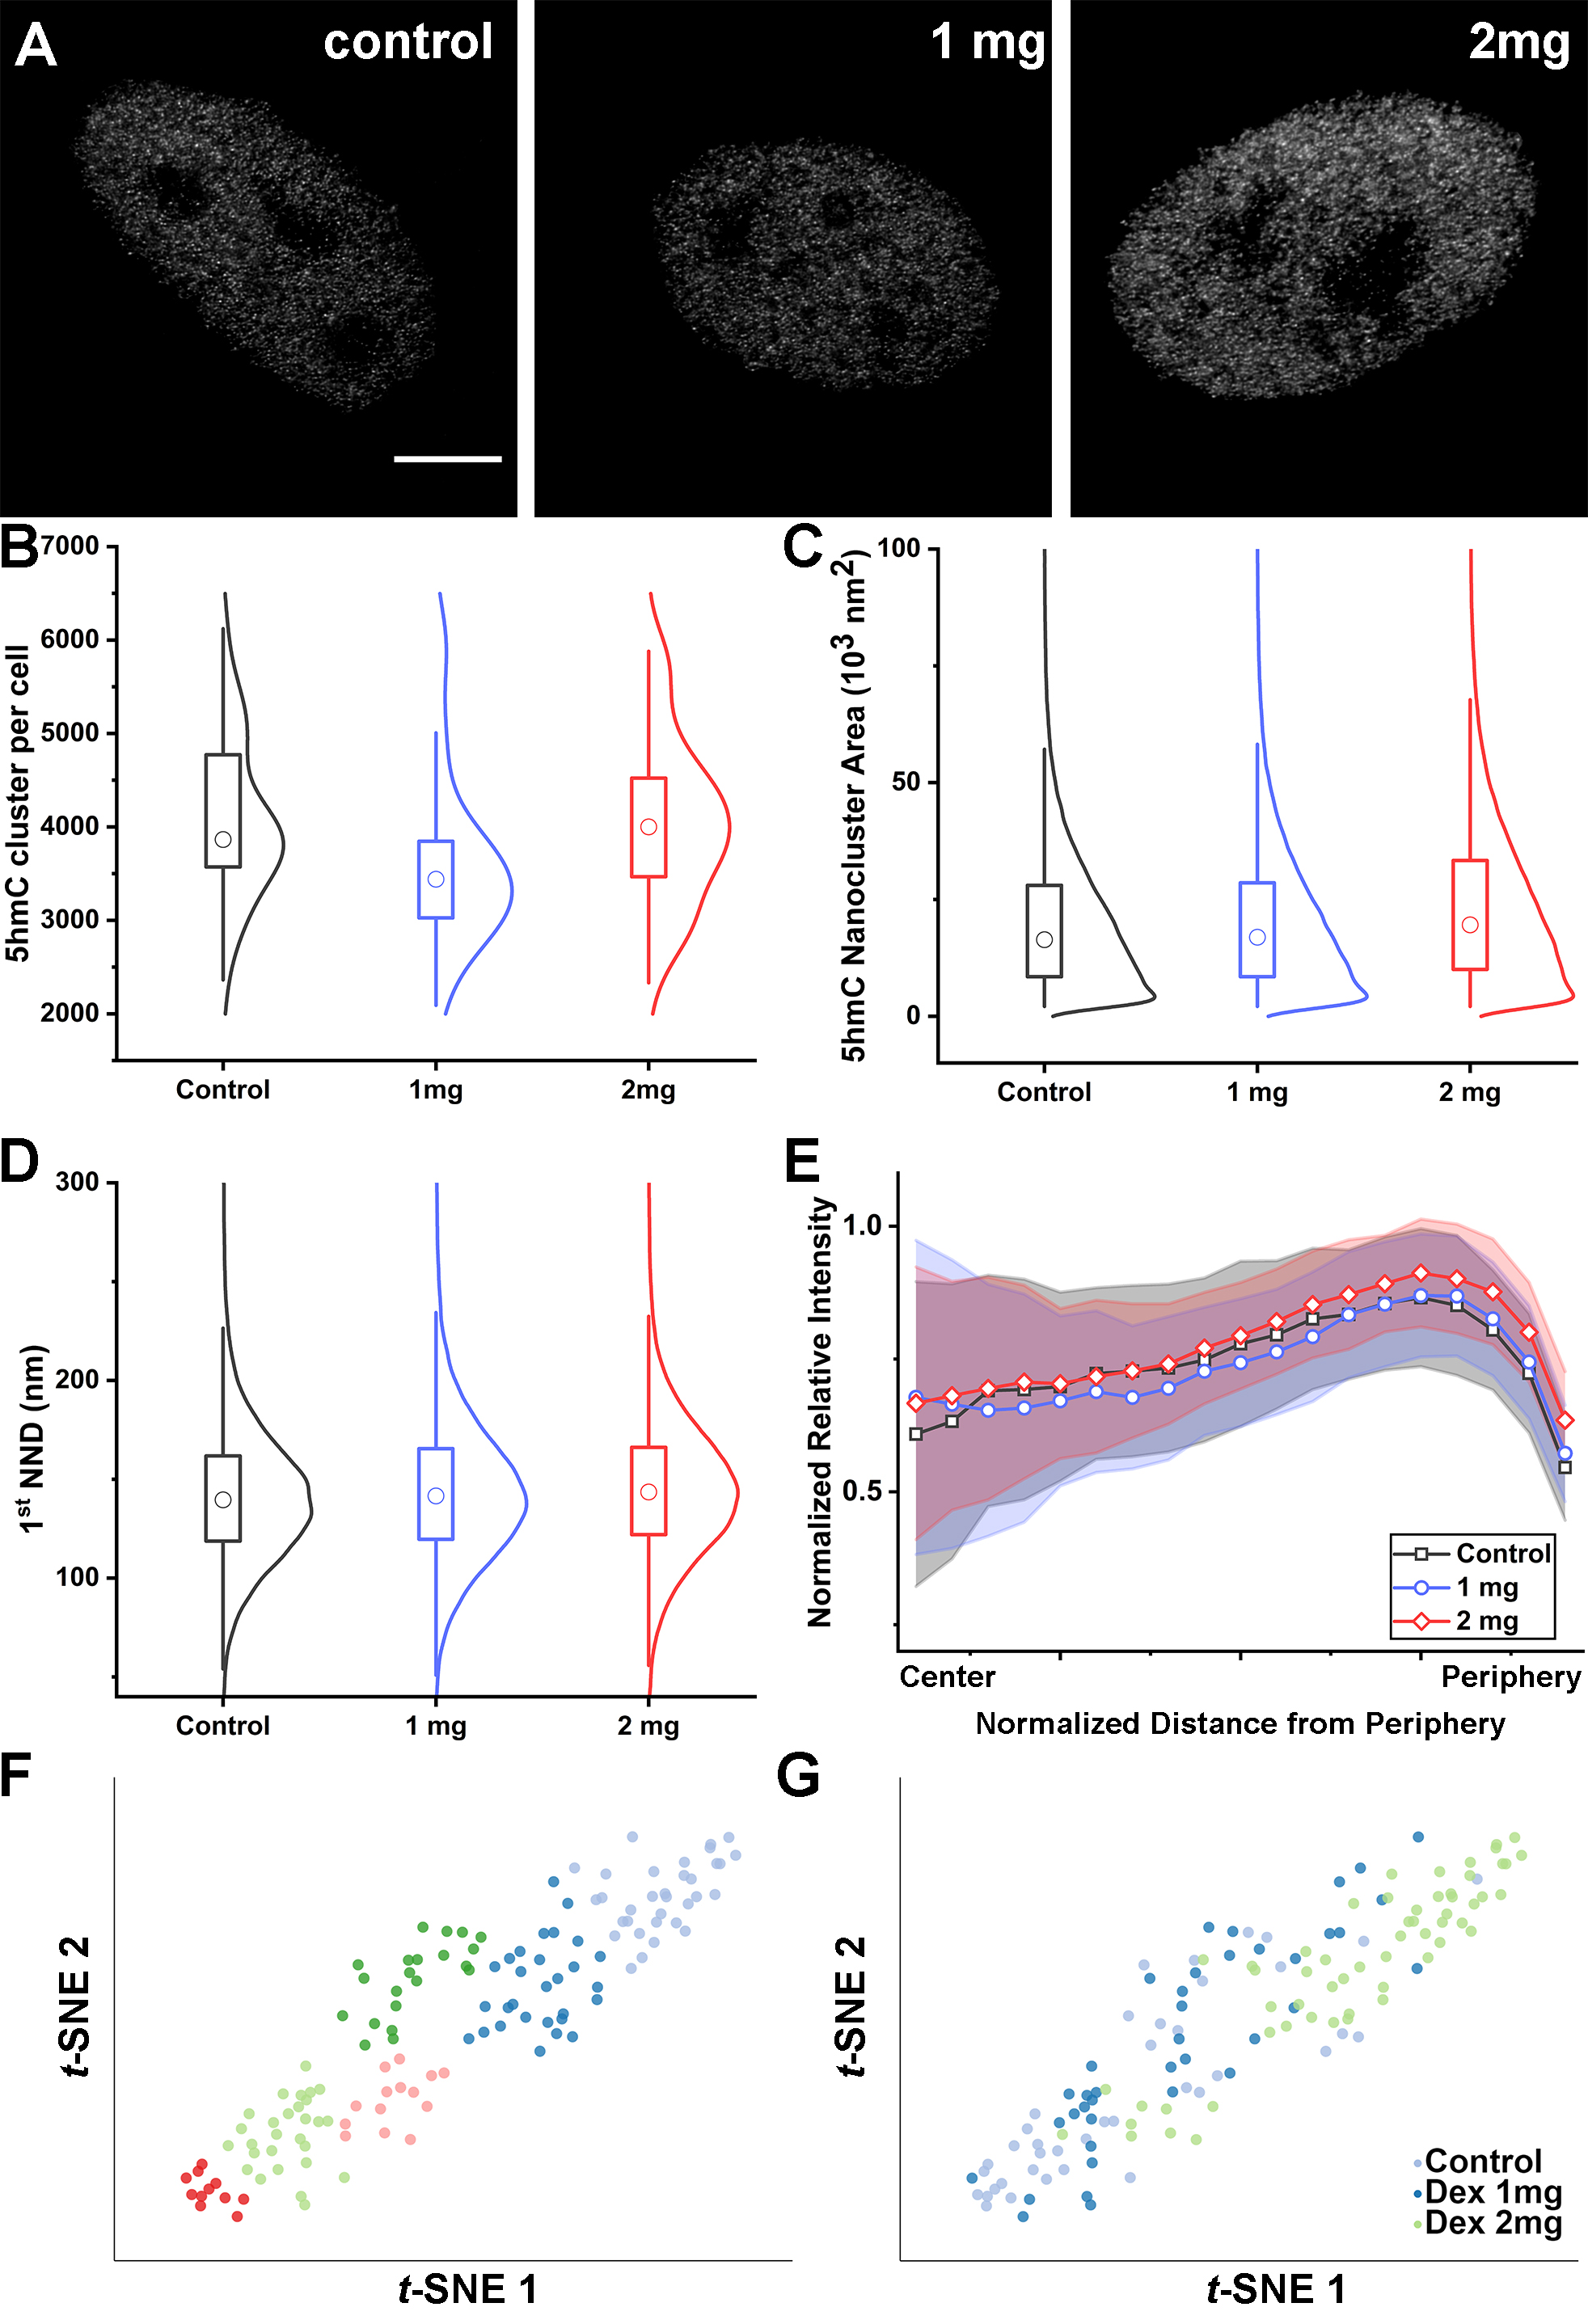
 Figure 4 of
Liu, Mol Vis 2021; 27:643-655.
Figure 4 of
Liu, Mol Vis 2021; 27:643-655.