Figure 1. Results of ddPCR assay. One-dimensional scatter plot for healthy control (left) and probands (right) of five CNVs. The pink
line is a manually set threshold, and gray points indicate template DNA negative droplets, while blue points represent template
DNA positive droplets. A. KIF11 exons 2–4; B. TSPAN12 exons 1–3; C. LRP5 exons 19–21; D. KIF11 exon 11; E. KIF11 exons 1–10.
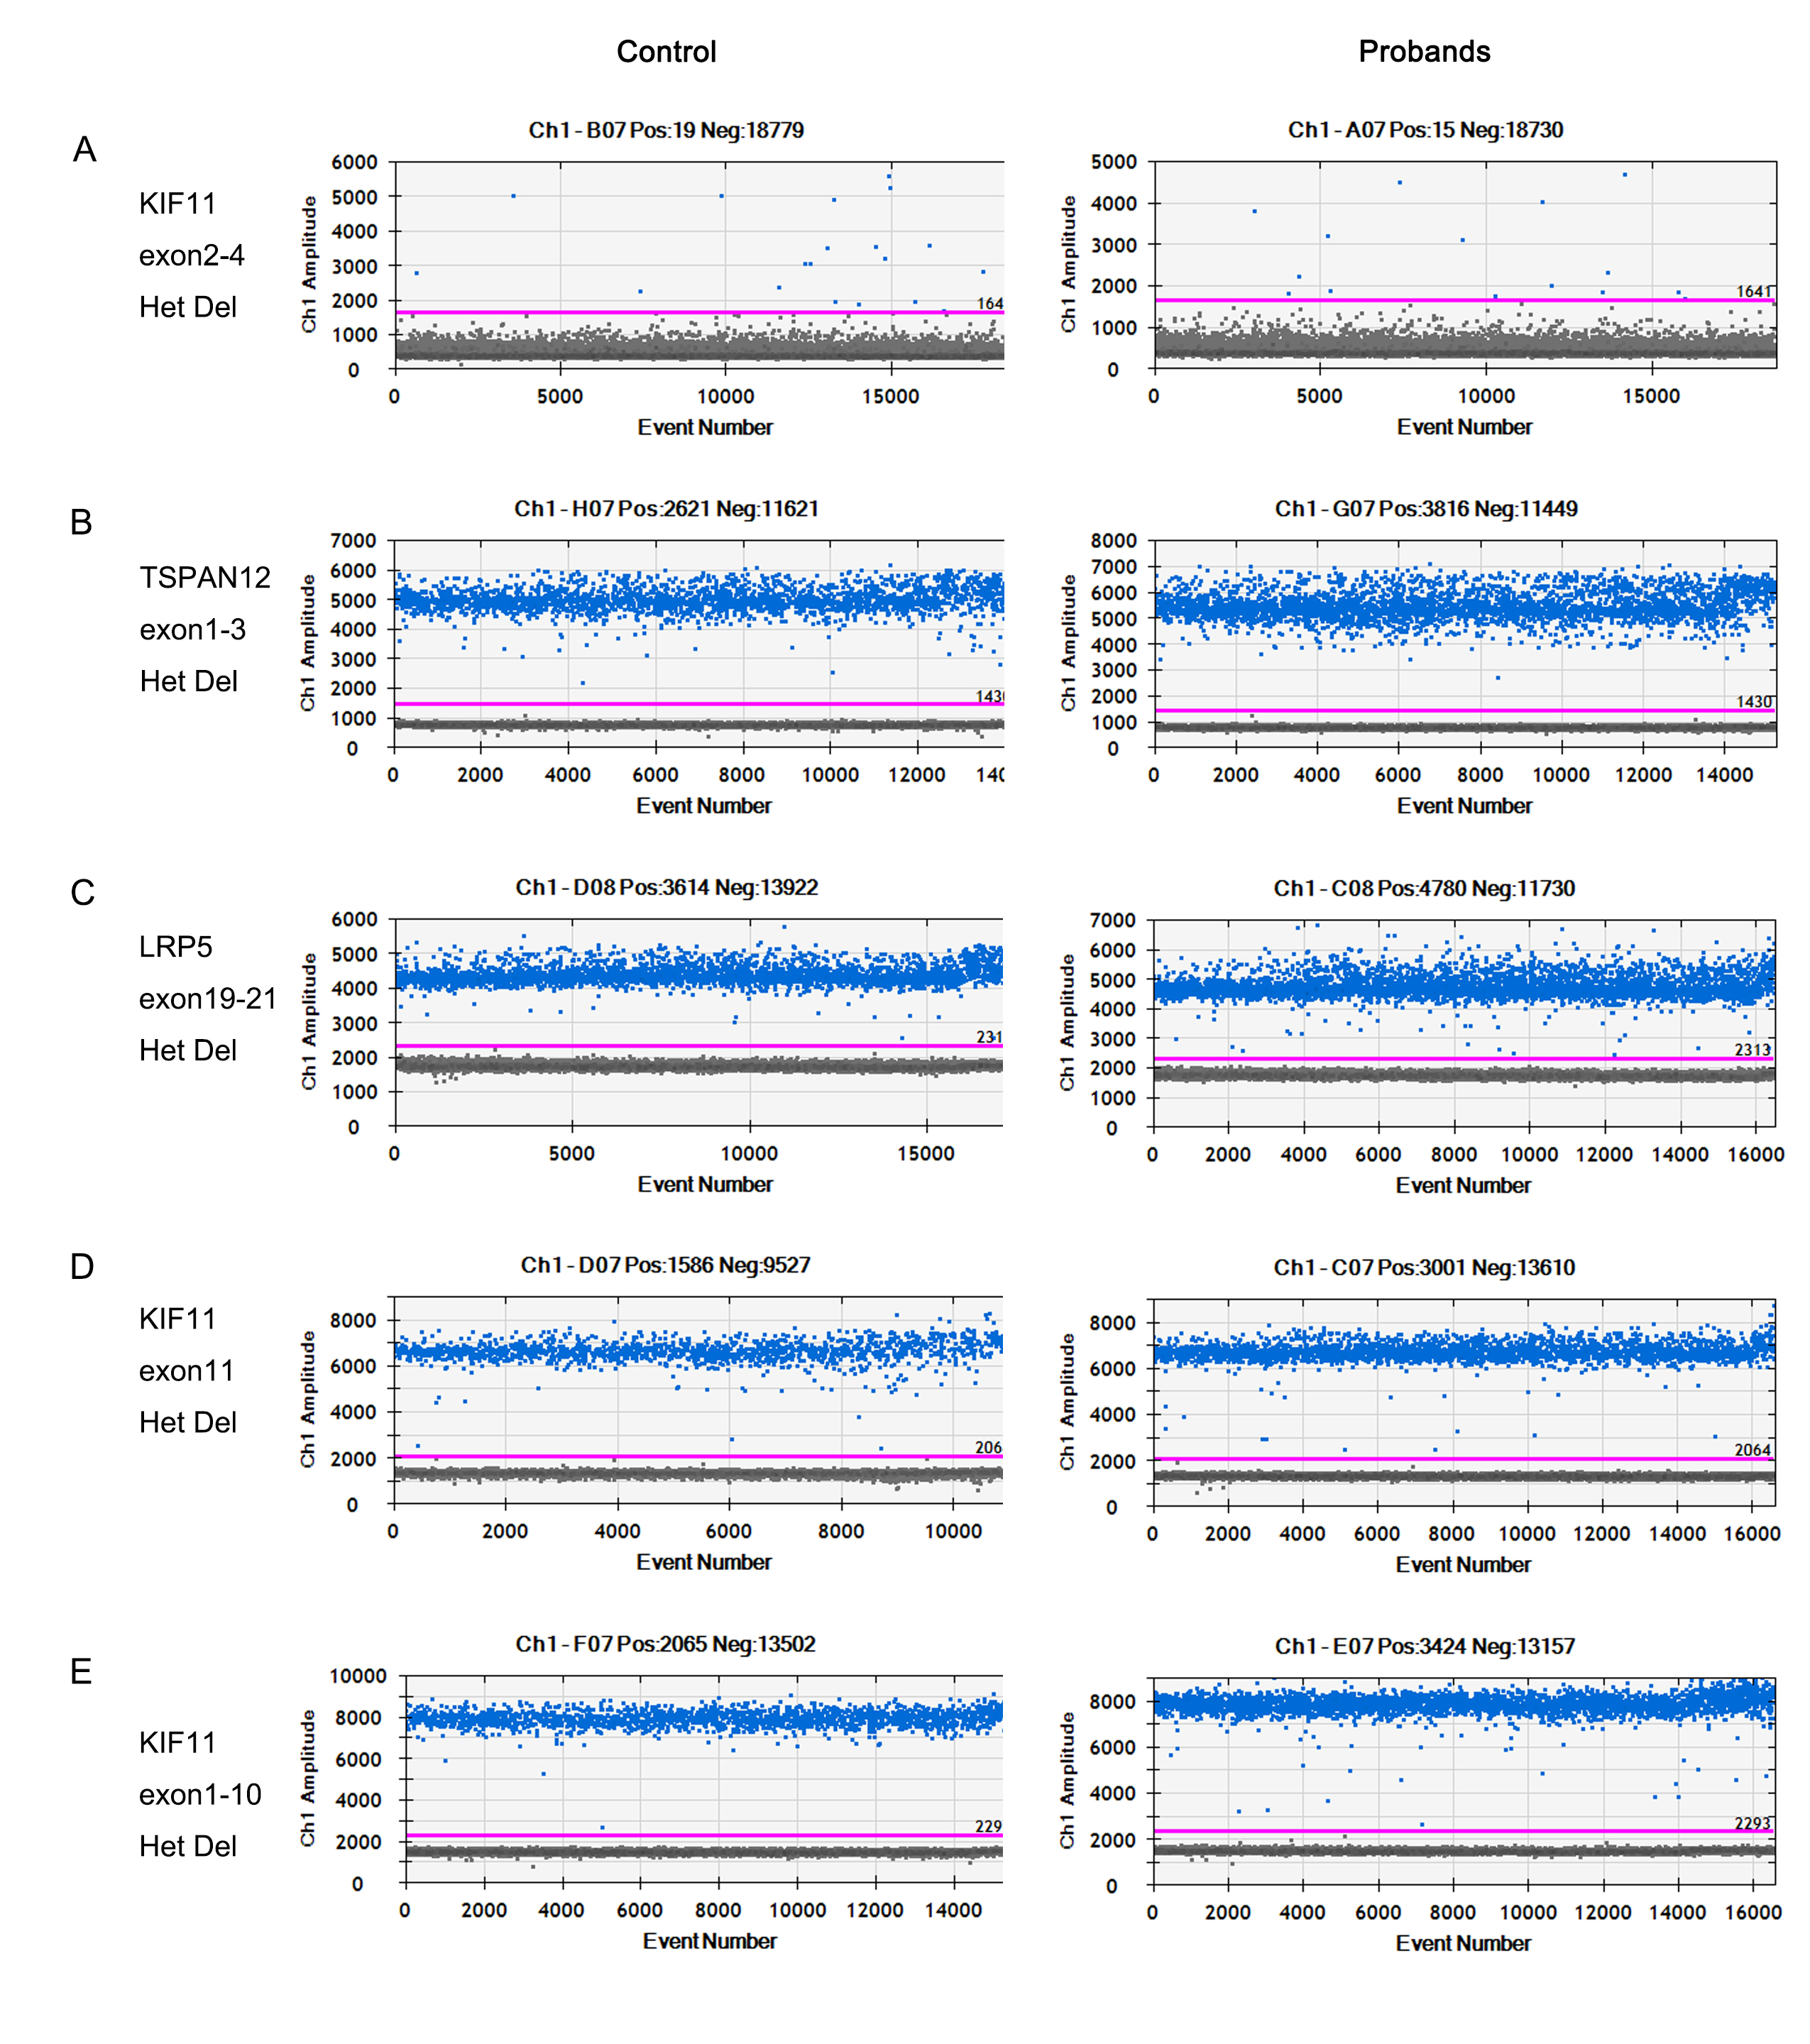
 Figure 1 of
Luo, Mol Vis 2021; 27:632-642.
Figure 1 of
Luo, Mol Vis 2021; 27:632-642.