Figure 4. Summary of the factors that explain the variance of the effect of inflammatory macrophages obtained using the LI-CNV and CSA
models. A mixed-design ANOVA with repeated measures was used to evaluate the effect of cell origin (blue), environment (red),
and the interaction between cell origin and environment (yellow). Unexplained variance is shown in green. The thick black
boxes are used to highlight the total variance explained by the environment and the interaction between the cell origin and
the environment.
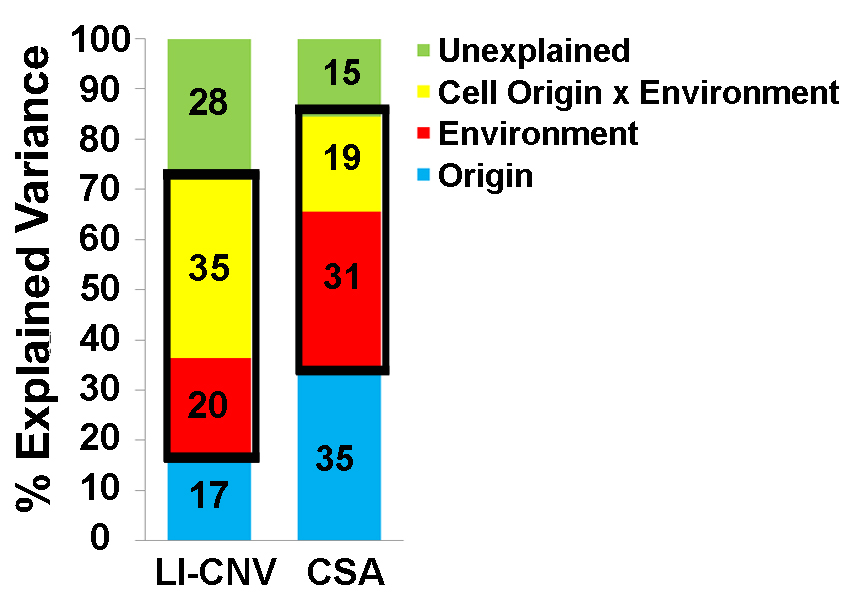
 Figure 4 of
Hagbi-Levi, Mol Vis 2021; 27:622-631.
Figure 4 of
Hagbi-Levi, Mol Vis 2021; 27:622-631.