Figure 3. Summary of the factors that explain the variance in cytokine expression at the mRNA and protein levels. A: A mixed-design ANOVA with repeated measures was used to evaluate the effect of cell origin (blue), environment (red), and
the interaction between cell origin and environment (yellow) on the mRNA levels of the indicated cytokines. B: A mixed-designed ANOVA with repeated measures on the protein levels of the indicated cytokines. Unexplained variance is
shown in green. The thick black boxes are used to highlight the total variance explained by Environment and the interaction
between cell origin and environment.
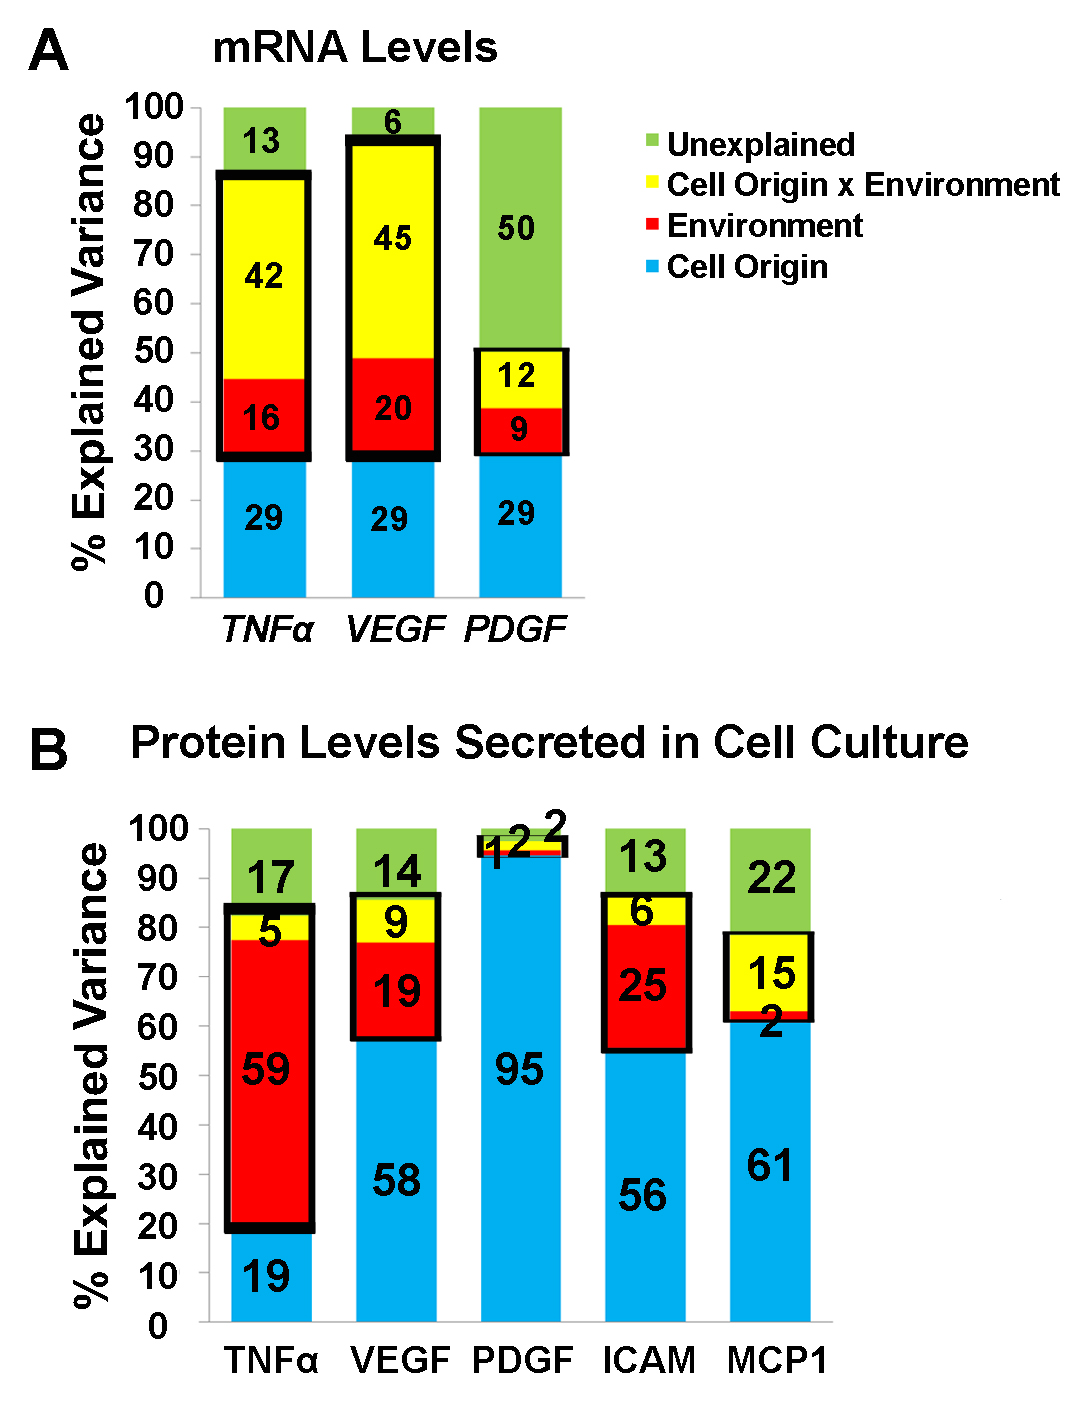
 Figure 3 of
Hagbi-Levi, Mol Vis 2021; 27:622-631.
Figure 3 of
Hagbi-Levi, Mol Vis 2021; 27:622-631.