Figure 7. RT-qPCR quantification of TGF-β1- and TGF-β2-induced fibrotic changes in the α-SMA, COL1A1, and fibronectin mRNA expression
of hTM cells at 1, 6, and 24 h after ATX and LPA treatment are shown. α-SMA was statistically significantly induced by lysophosphatidic
acid (LPA; 6 h, 24 h) and autotaxin (ATX; 24 h), and these effects were statistically significantly attenuated by the LPAR
antagonist, ATX inhibitor, or ROCK inhibitor. COL1A1 was statistically significantly induced by LPA (6 h) and ATX (6 h), and
these effects were statistically significantly attenuated by the LPAR antagonist, ATX inhibitor, or ROCK inhibitor. ATX was
upregulated by ATX (1 h). Real-time quantitative PCR (RT-qPCR) was performed with GAPDH primers to serve as an internal control for input DNA. Values are the mean ± standard deviation of four independent samples.
*p<0.05, **p<0.01, ***p<0.001, †p<0.0001.
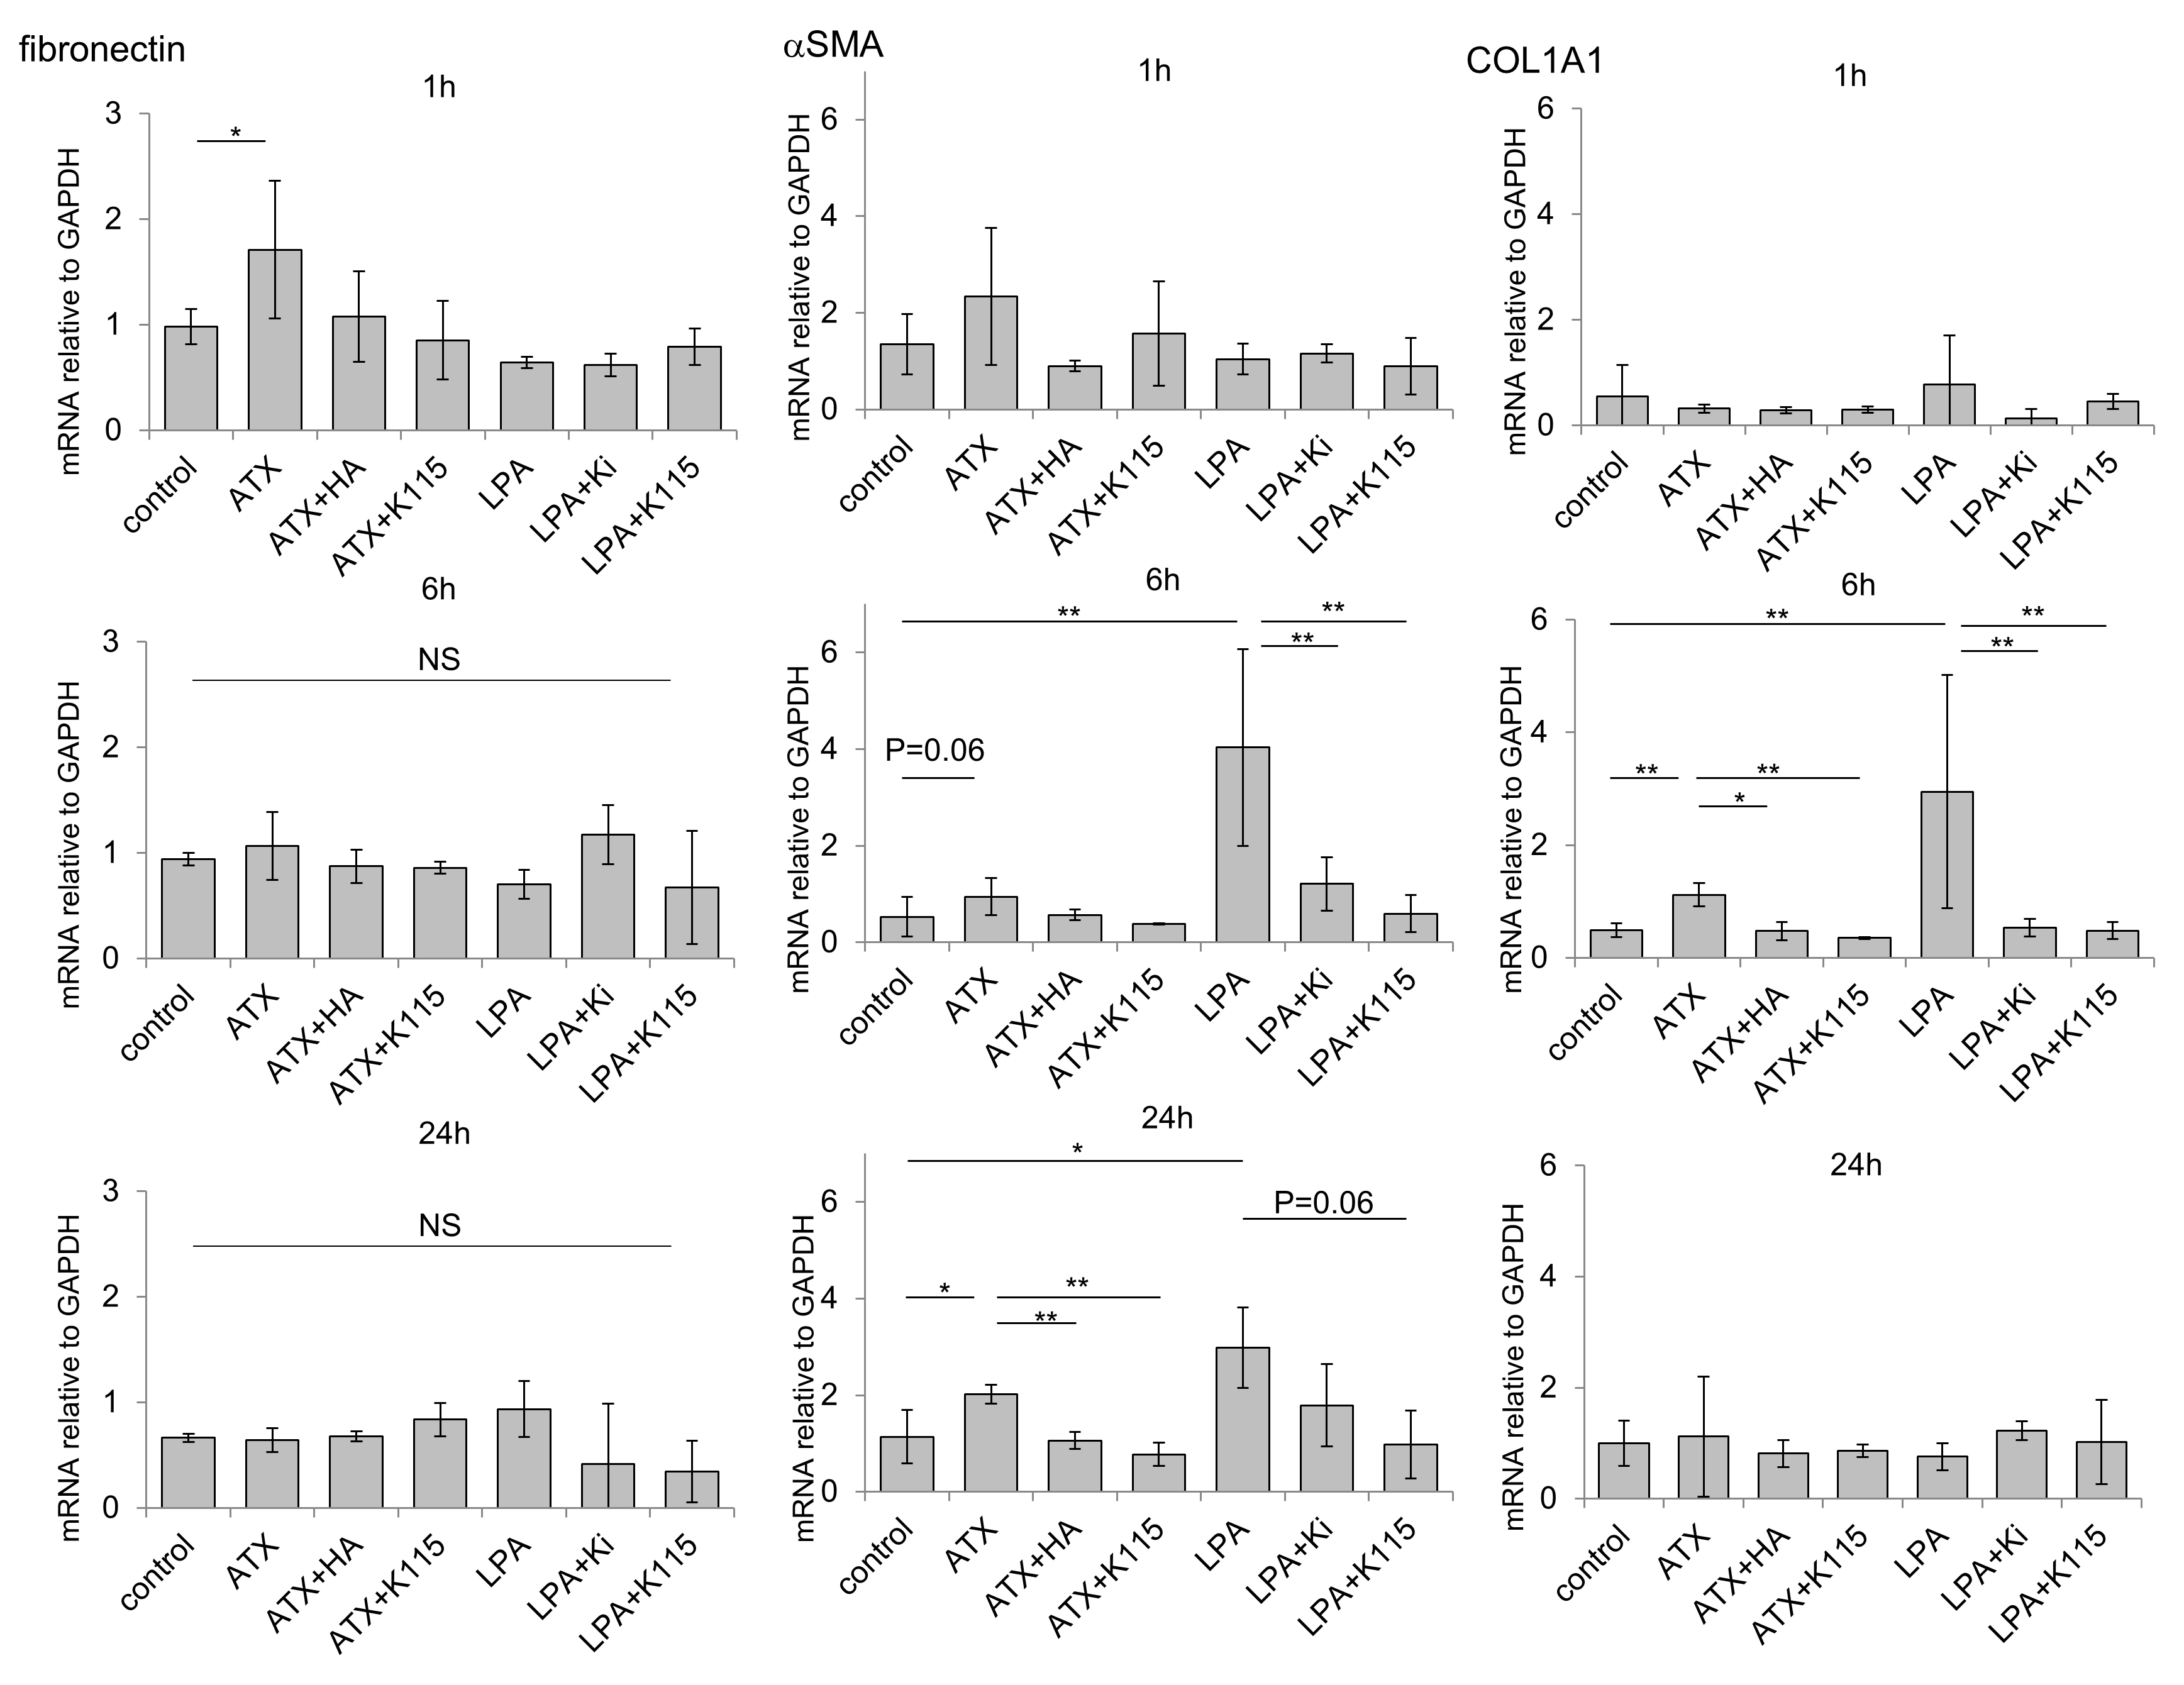
 Figure 7 of
Nakamura, Mol Vis 2021; 27:61-77.
Figure 7 of
Nakamura, Mol Vis 2021; 27:61-77.