Figure 3. RT-qPCR quantification of TGF-β1 and TGF-β2-induced fibrotic changes in hTM cells α-SMA, COL1A1, and fibronectin mRNA expression
were statistically significantly induced with 10 ng/ml TGF-β2 treatment (24 h). With the exception of fibronectin, these effects
were statistically significantly attenuated by the TGF-β inhibitor or the ROCK inhibitor. TGF-β1 (10 ng/ml, 24 h) induced
statistically significant increased expression of only α-SMA, but not COL1A1 or fibronectin. Real-time quantitative PCR (RT-qPCR)
was performed with GAPDH primers as an internal control for input DNA. Data are the averages of four independent samples. Values are the mean ± standard
deviation. *p<0.05, **p<0.01, ***p<0.001, †p<0.0001.
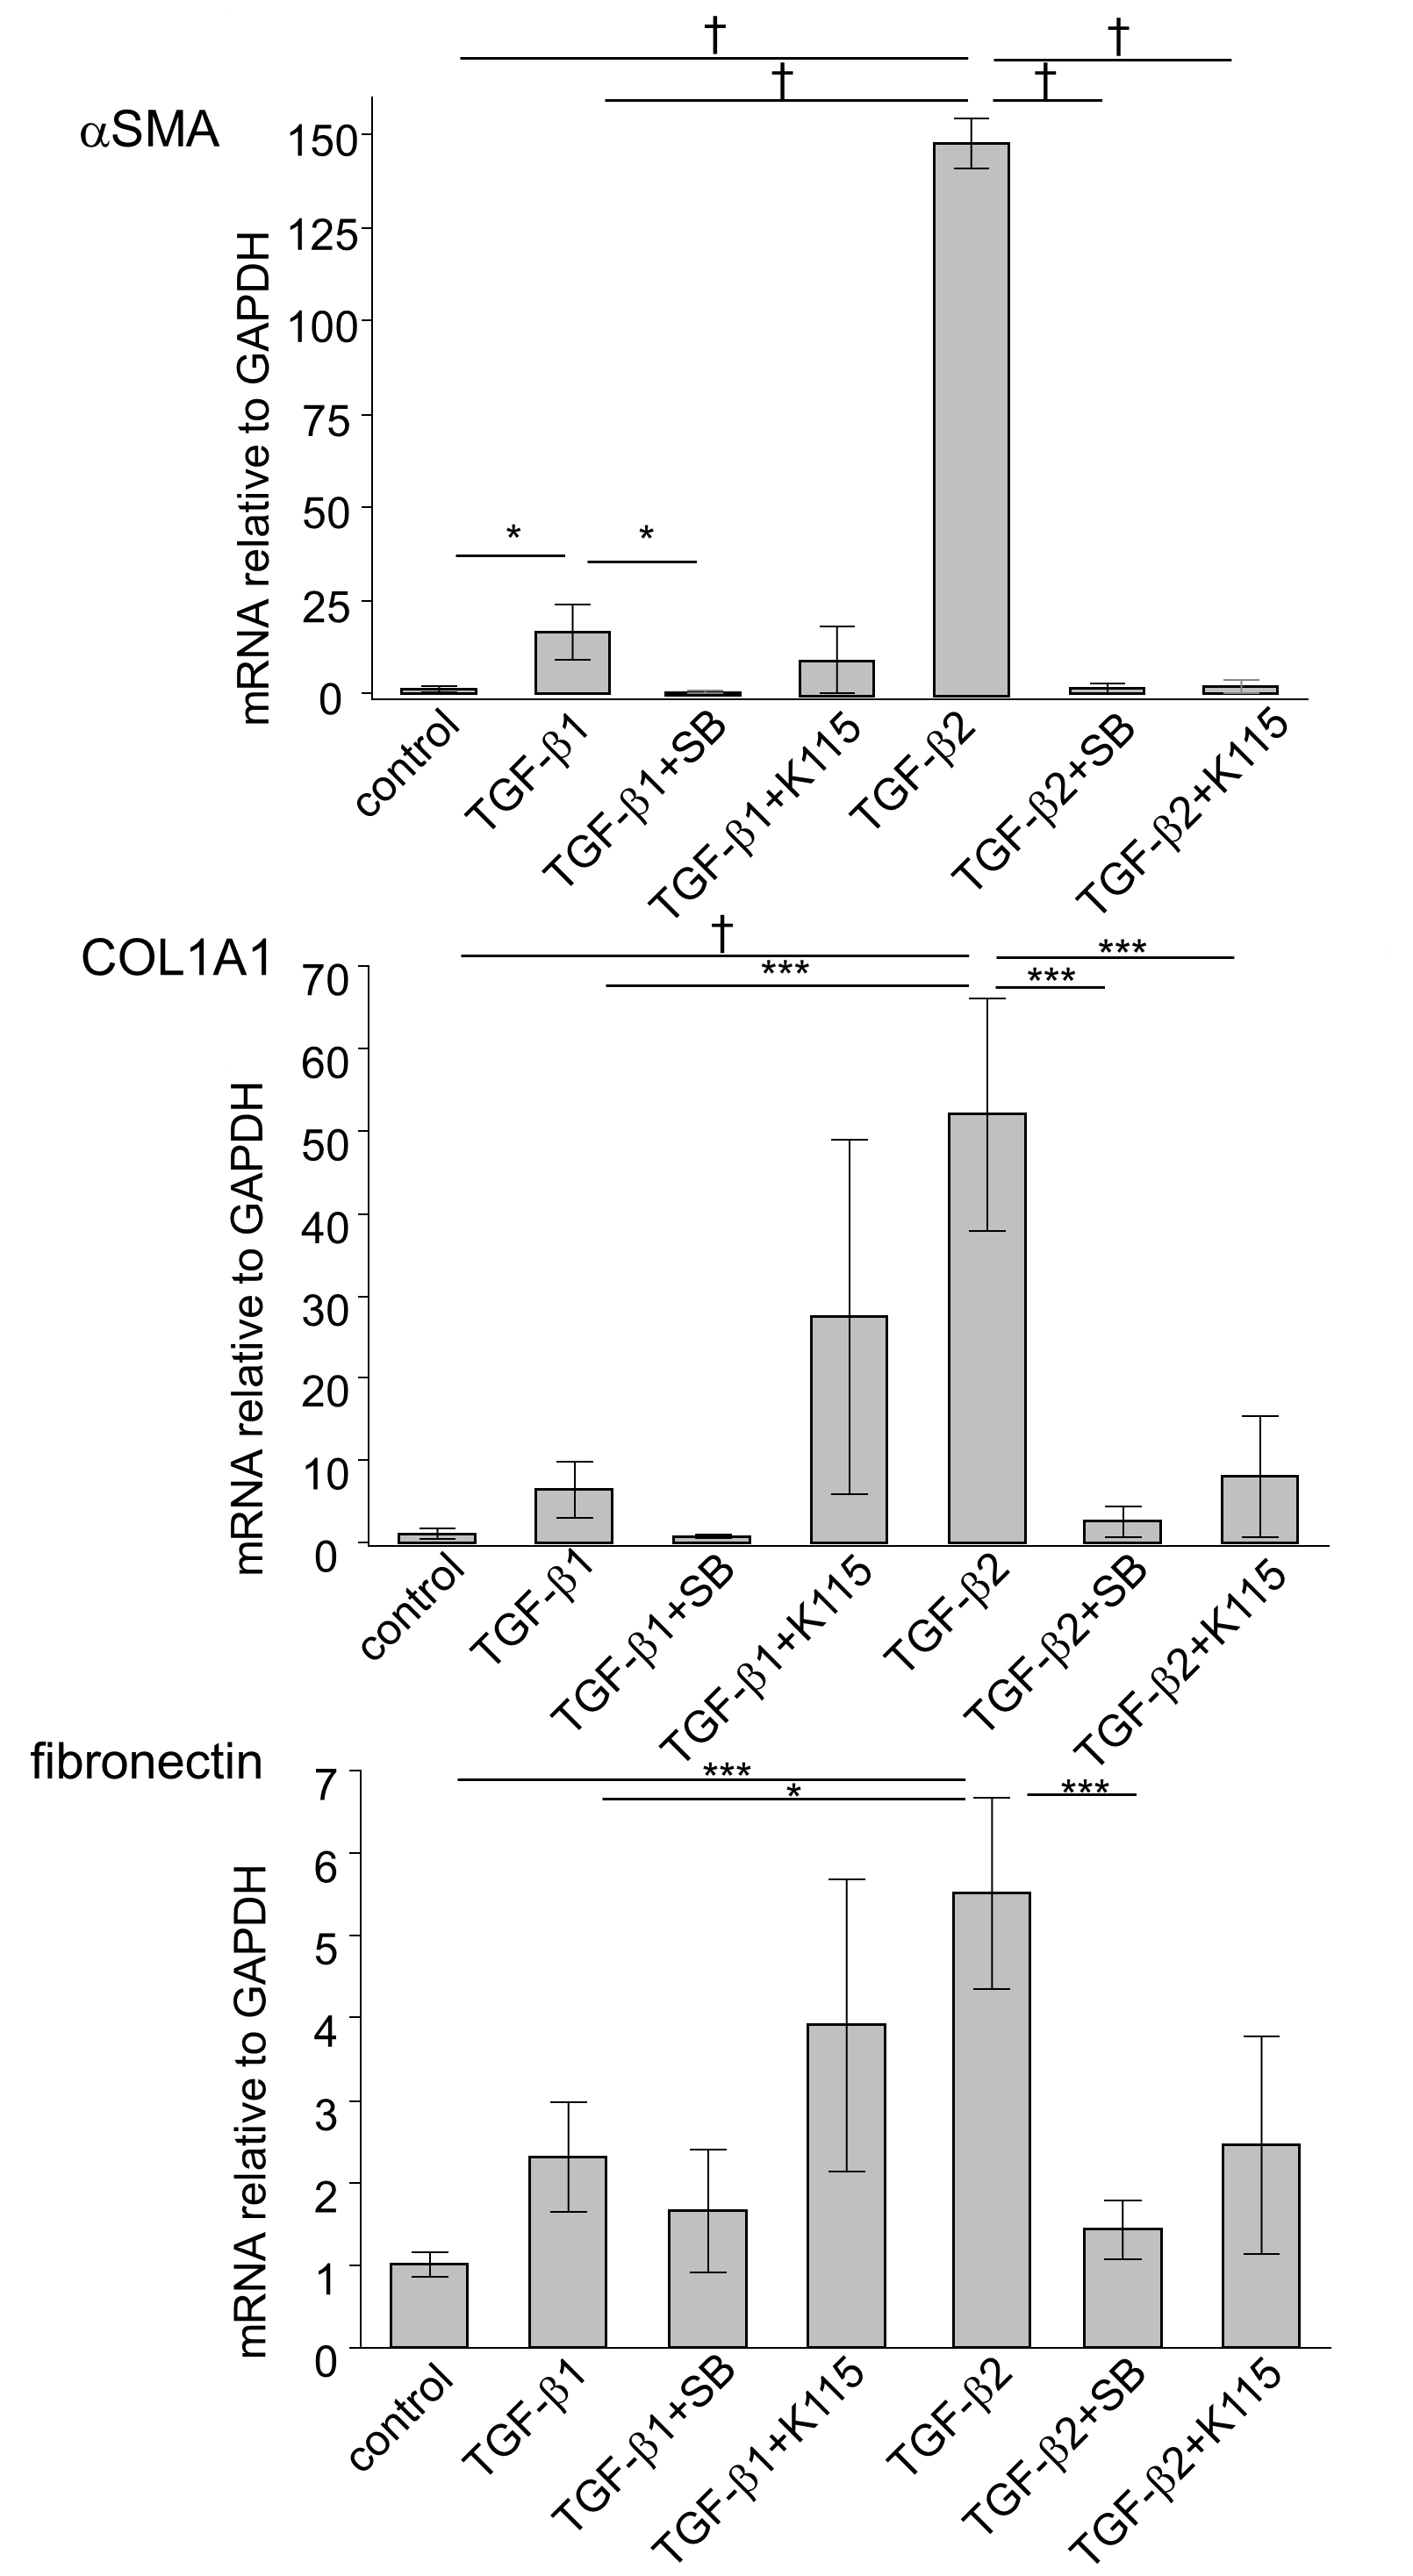
 Figure 3 of
Nakamura, Mol Vis 2021; 27:61-77.
Figure 3 of
Nakamura, Mol Vis 2021; 27:61-77.