Figure 6. Refining a region of interest (ROI) with greatest difference in RGC density in glaucoma-affected retina. A: Region of interest 1 (ROI 1): This region of the heat map was defined by placing the heat map on the Cartesian coordinate
system, with the center of the retina at (0,0) and extending 135° clockwise from the positive y-axis. B: ROI 1 probability density plot: This plot does not show a large difference in the density distribution between normal wild-type
(wt; N1–3; dark gray) and feline congenital glaucoma (FCG)-affected (A3–7; light gray) retinas in this ROI. C: Region of interest 2 (ROI 2): This region of the density heat map decreased the size of ROI 1 by measuring 20 bins temporally
from the center of the retina and mapping an intersecting vector. D: ROI 2 probability density plot: A far more discernable difference in densities between the normal wt (dark gray) and FCG-affected
(light gray) groups can be seen on this plot, with a shift toward higher densities in the normal wt retinas. This is likely
because most of the artifacts in the peripheral retina inserting bins with 0 somas has been taken away. Differences in the
regional mean densities between the groups are negligible in the peripheral retina.
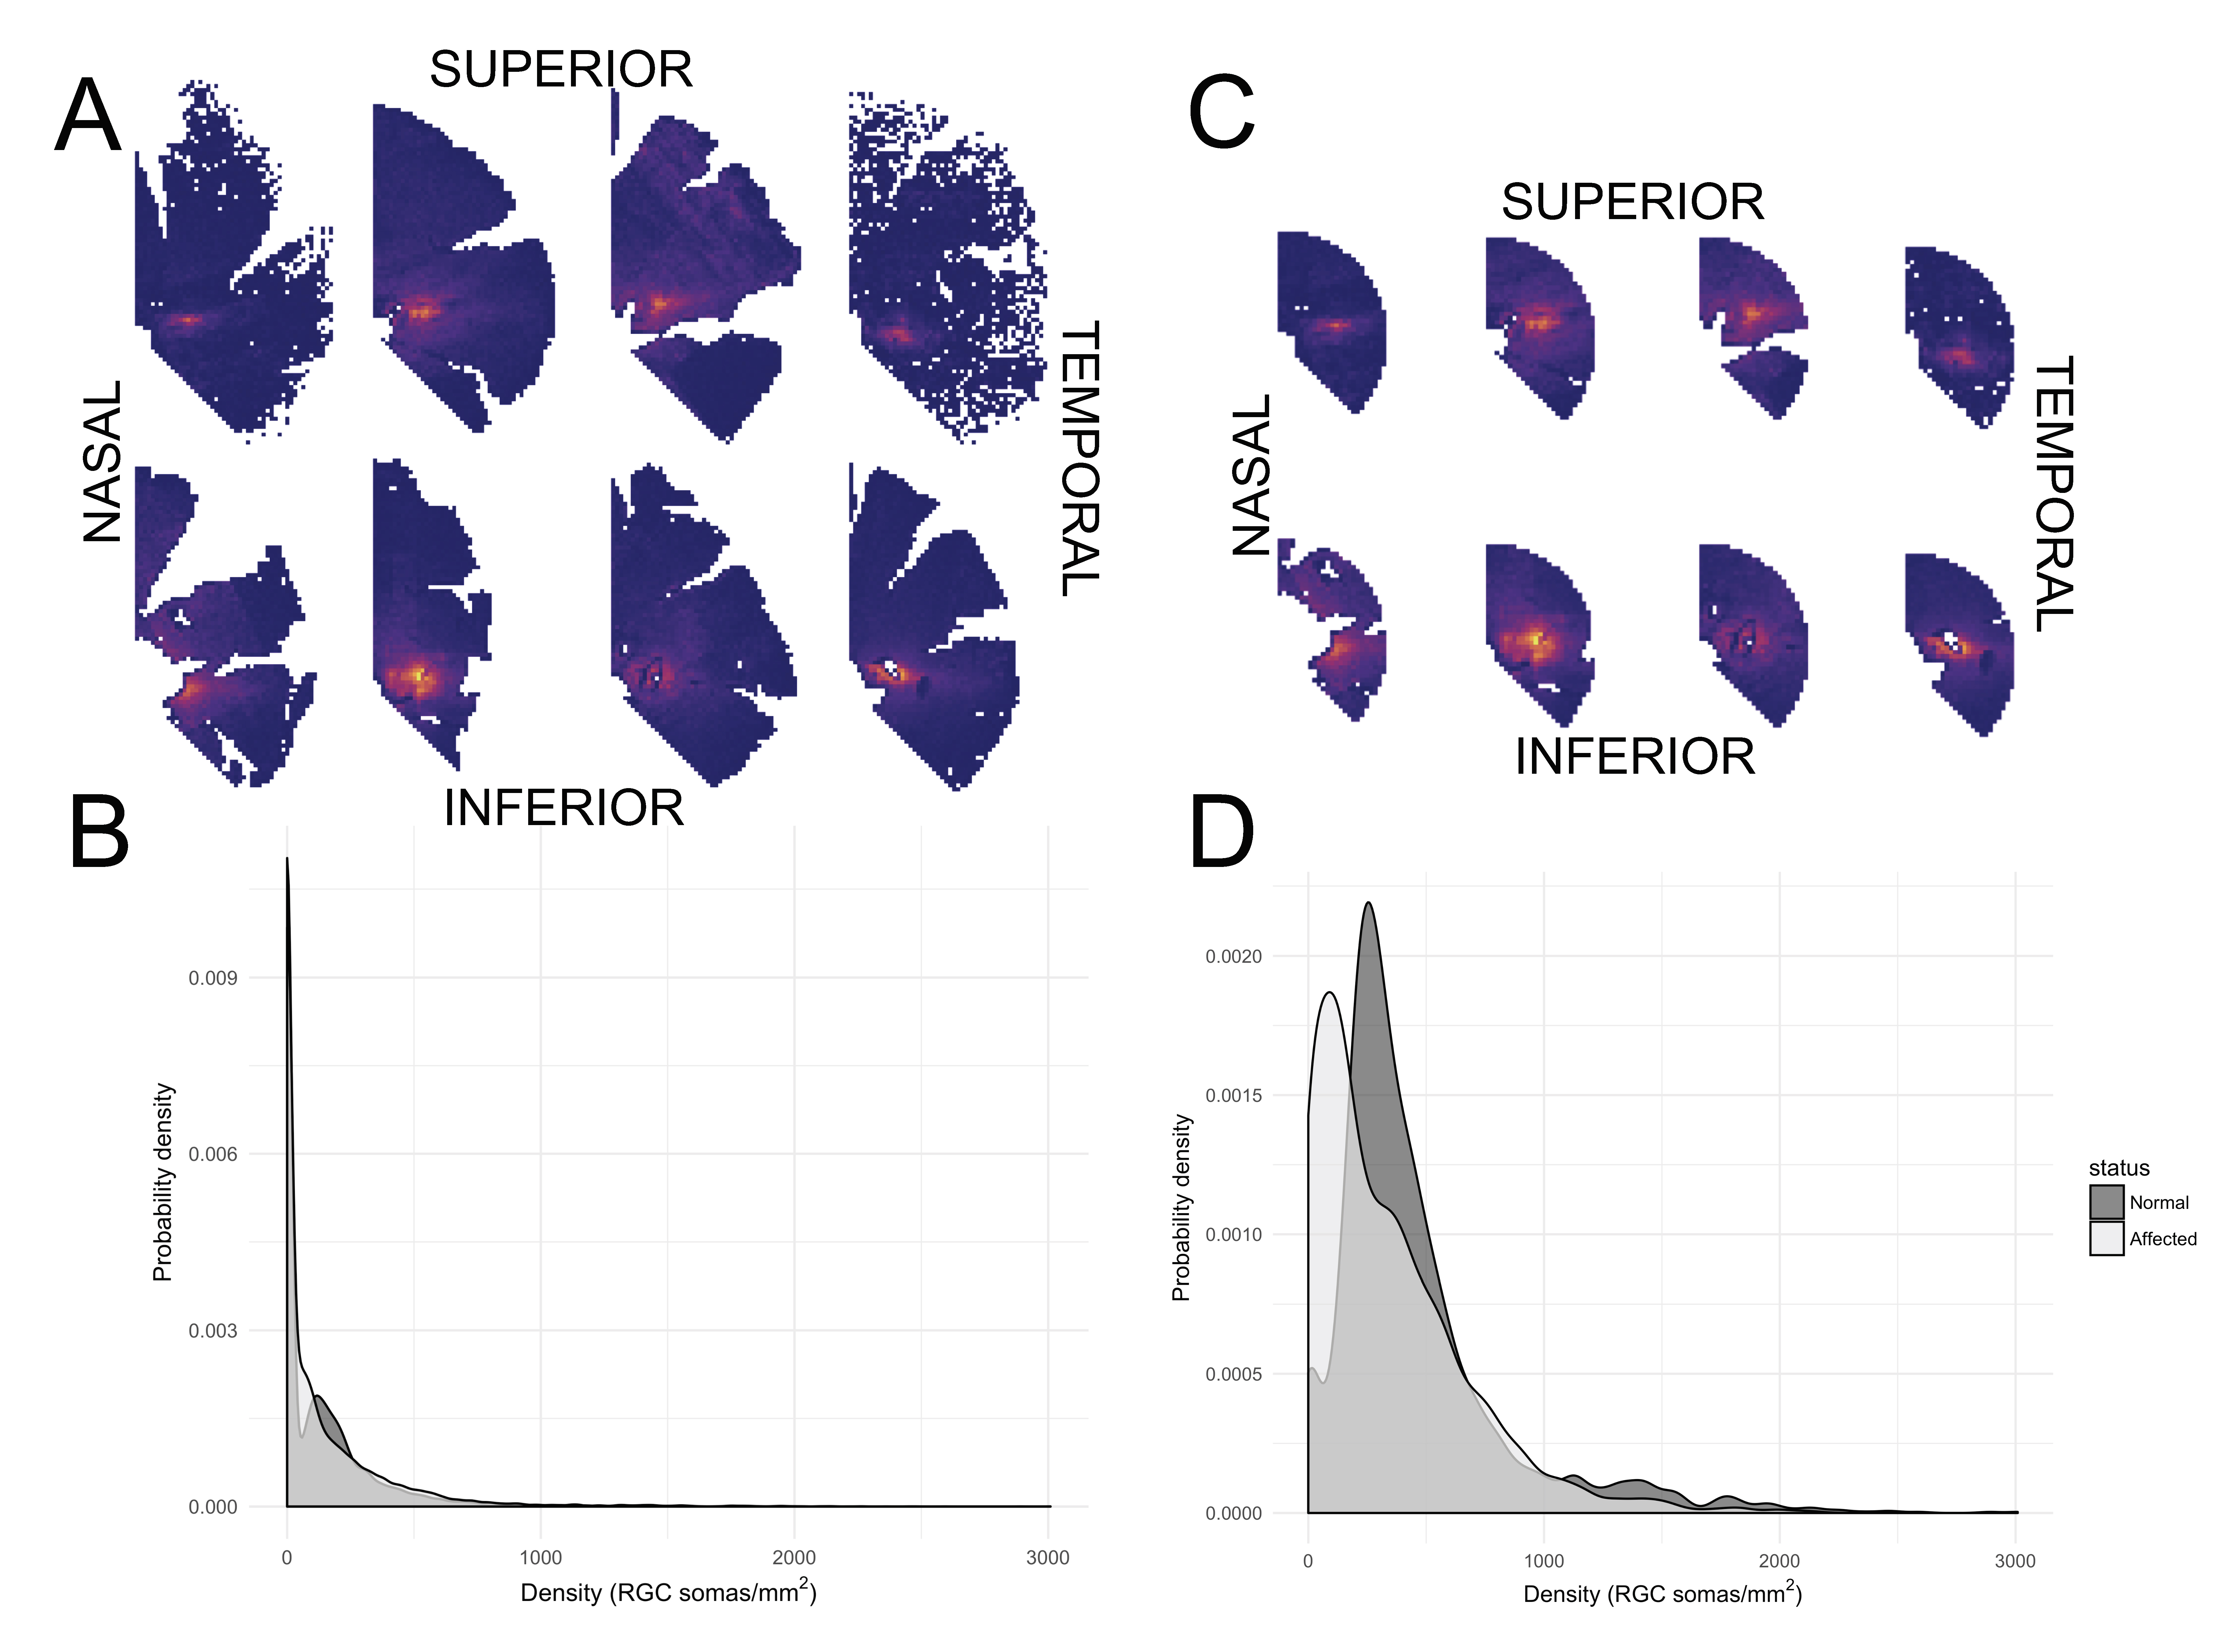
 Figure 6 of
Adelman, Mol Vis 2021; 27:608-621.
Figure 6 of
Adelman, Mol Vis 2021; 27:608-621.