Figure 5. Heat maps of RGC densities. A: Density topography of RGC somas in three normal wild-type (wt) retinas (N1–3) and five feline congenital glaucoma (FCG)-affected
retinas (A2–6). In all retinas, the area of highest density, or the warmest colors, can be seen in the region of the area
centralis, temporal to the location of the optic nerve head. B: Density heat map of the difference between the regional mean of the normal wt group and the FCG-affected group (i.e., normal
minus affected). The groups did not seem to differ substantially within the peripheral retina. The largest difference in mean
RGC soma densities between groups (warmest colors) can be seen in the region of the area centralis. C: K-means cluster algorithm with clusters 2–9. Throughout all the groups, the k-means cluster algorithm indicates the area
of least regional variability in between-group differences in soma density within the temporal retina, associated with the
area centralis.
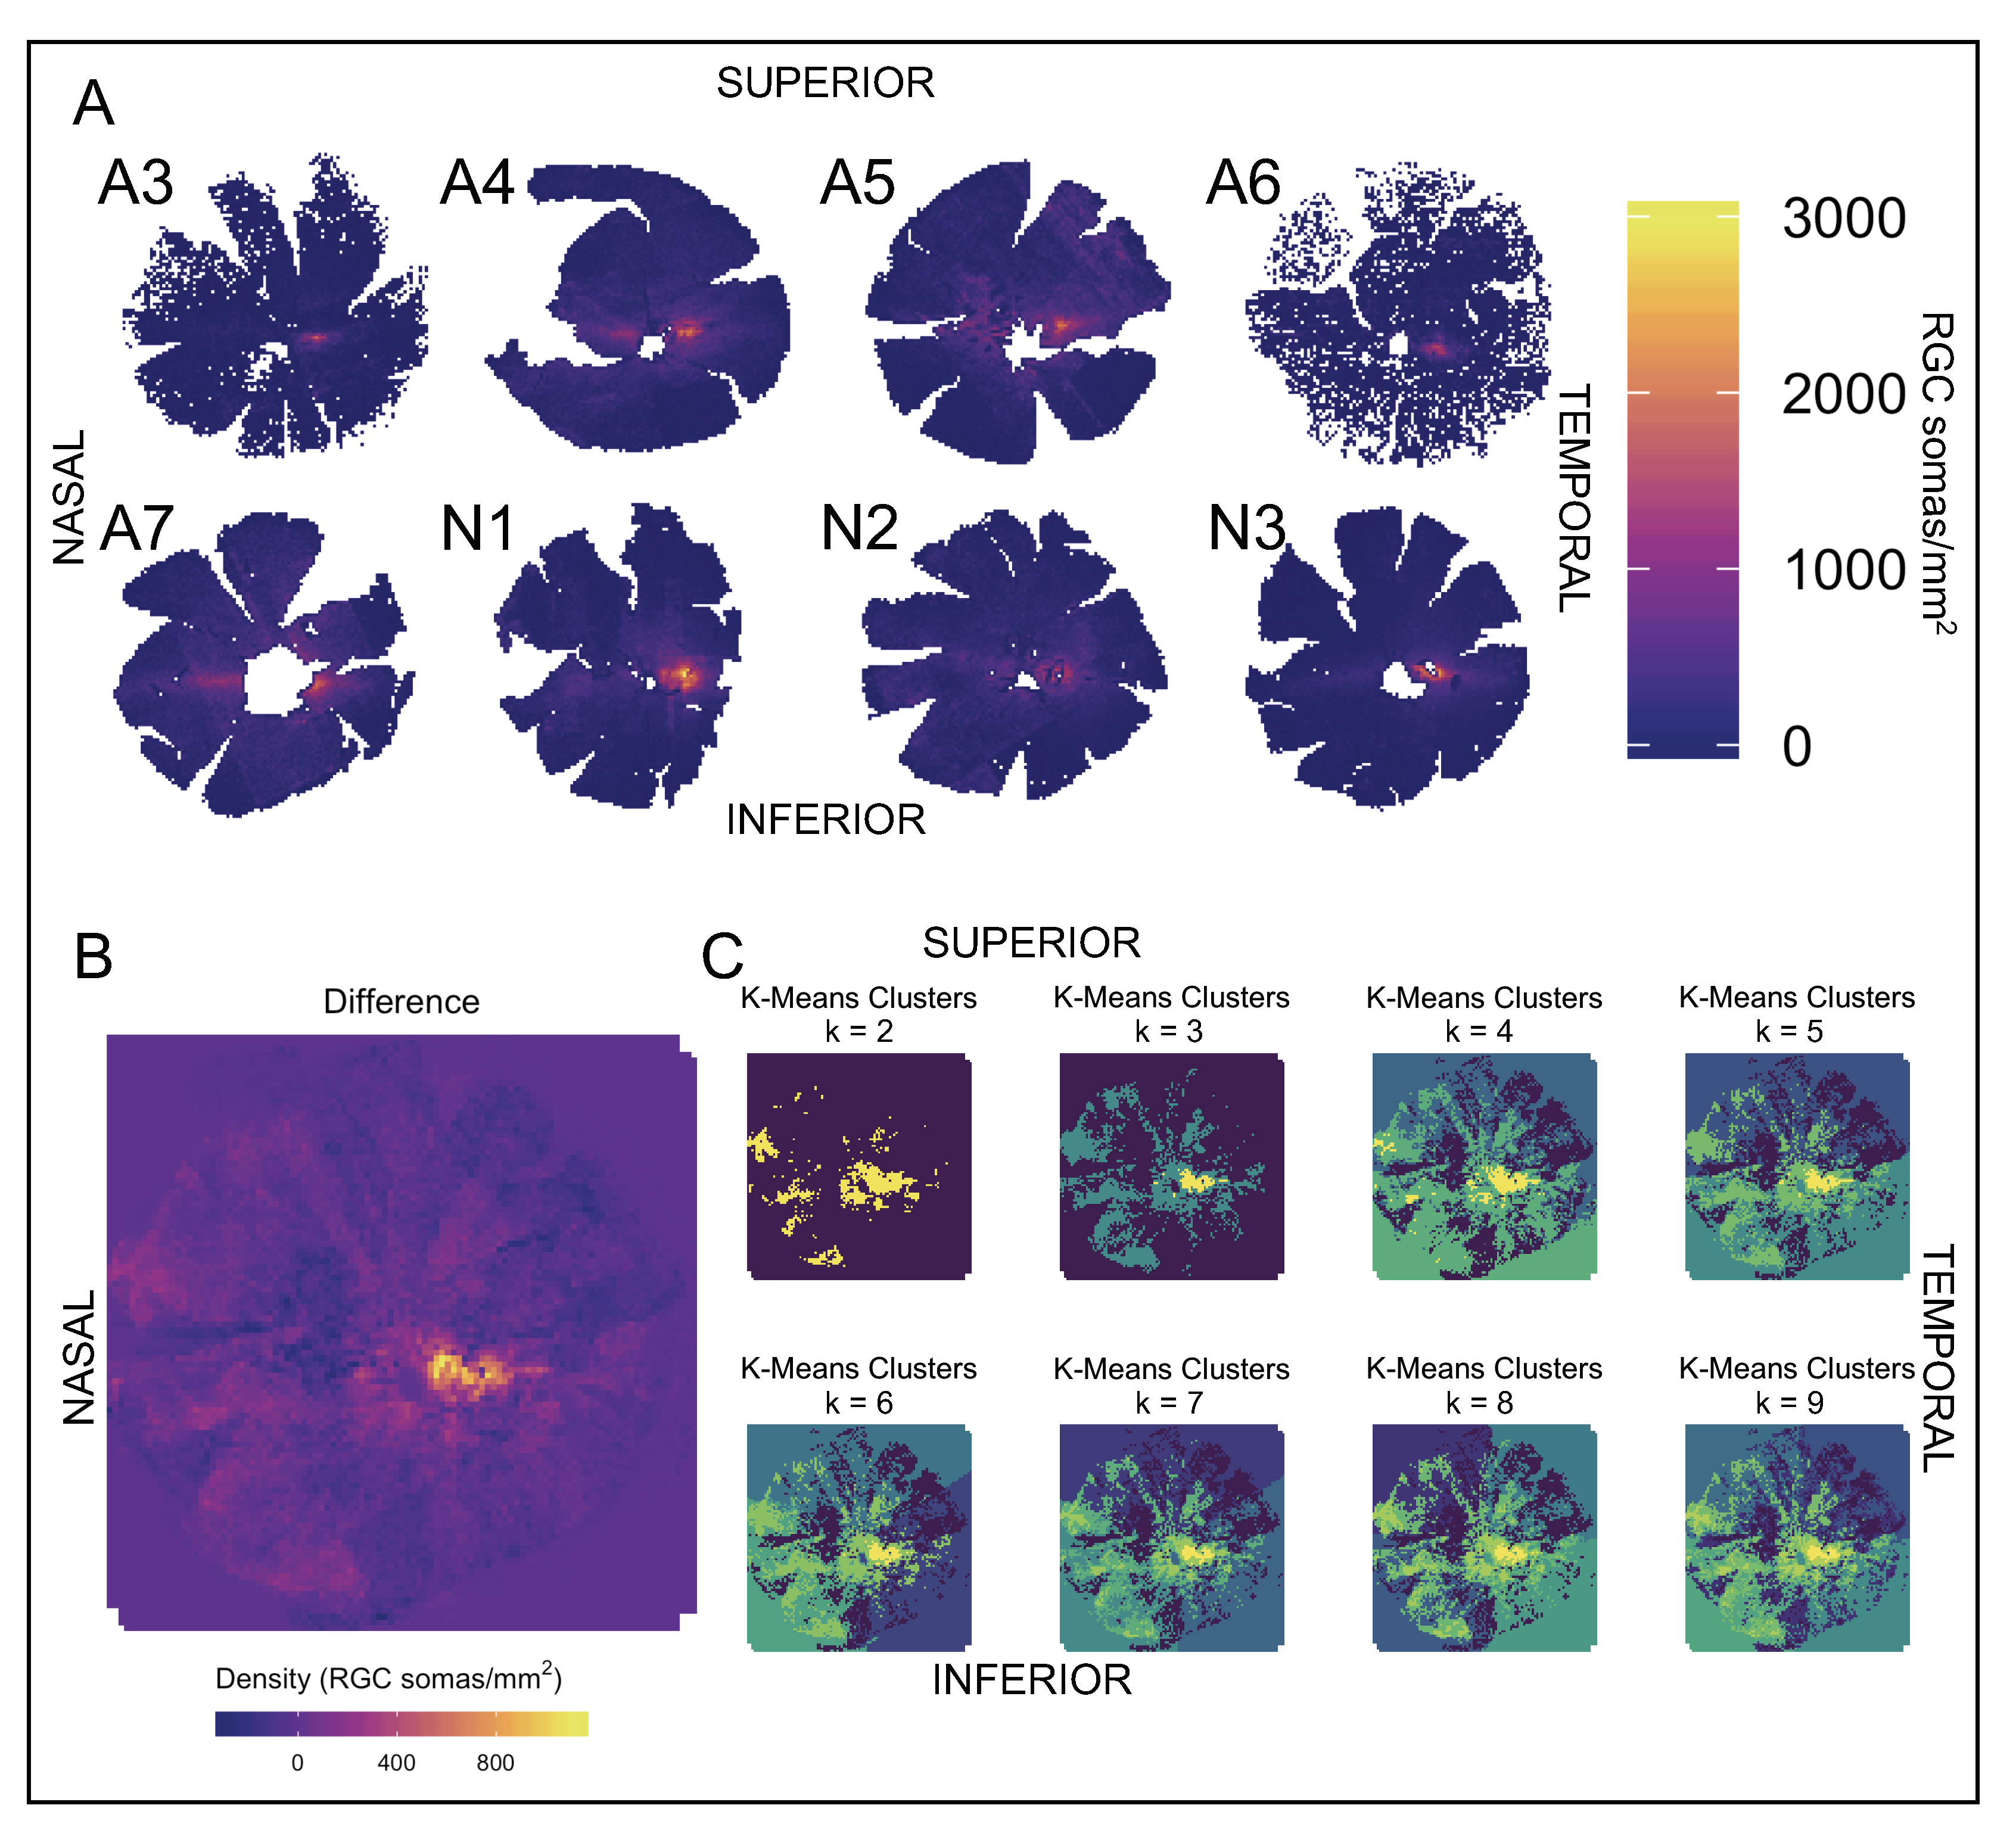
 Figure 5 of
Adelman, Mol Vis 2021; 27:608-621.
Figure 5 of
Adelman, Mol Vis 2021; 27:608-621.