Figure 4. Peak RGC densities. Box-and-whisker plots of the highest RGC soma densities in (A) the area centralis and (B) a more defined 0.17 mm2 bin in the center of the area centralis. The smaller bin (0.17 mm2) was manually placed in the center of the area centralis, defined using vasculature and the highest apparent density. The
whiskers represent the range of values, and each data point shown represents the cell density calculated for an individual
eye/subject. There was no statistically significant difference in mean densities between the normal wild-type (wt), and feline
congenital glaucoma (FCG)-affected groups for either metric.
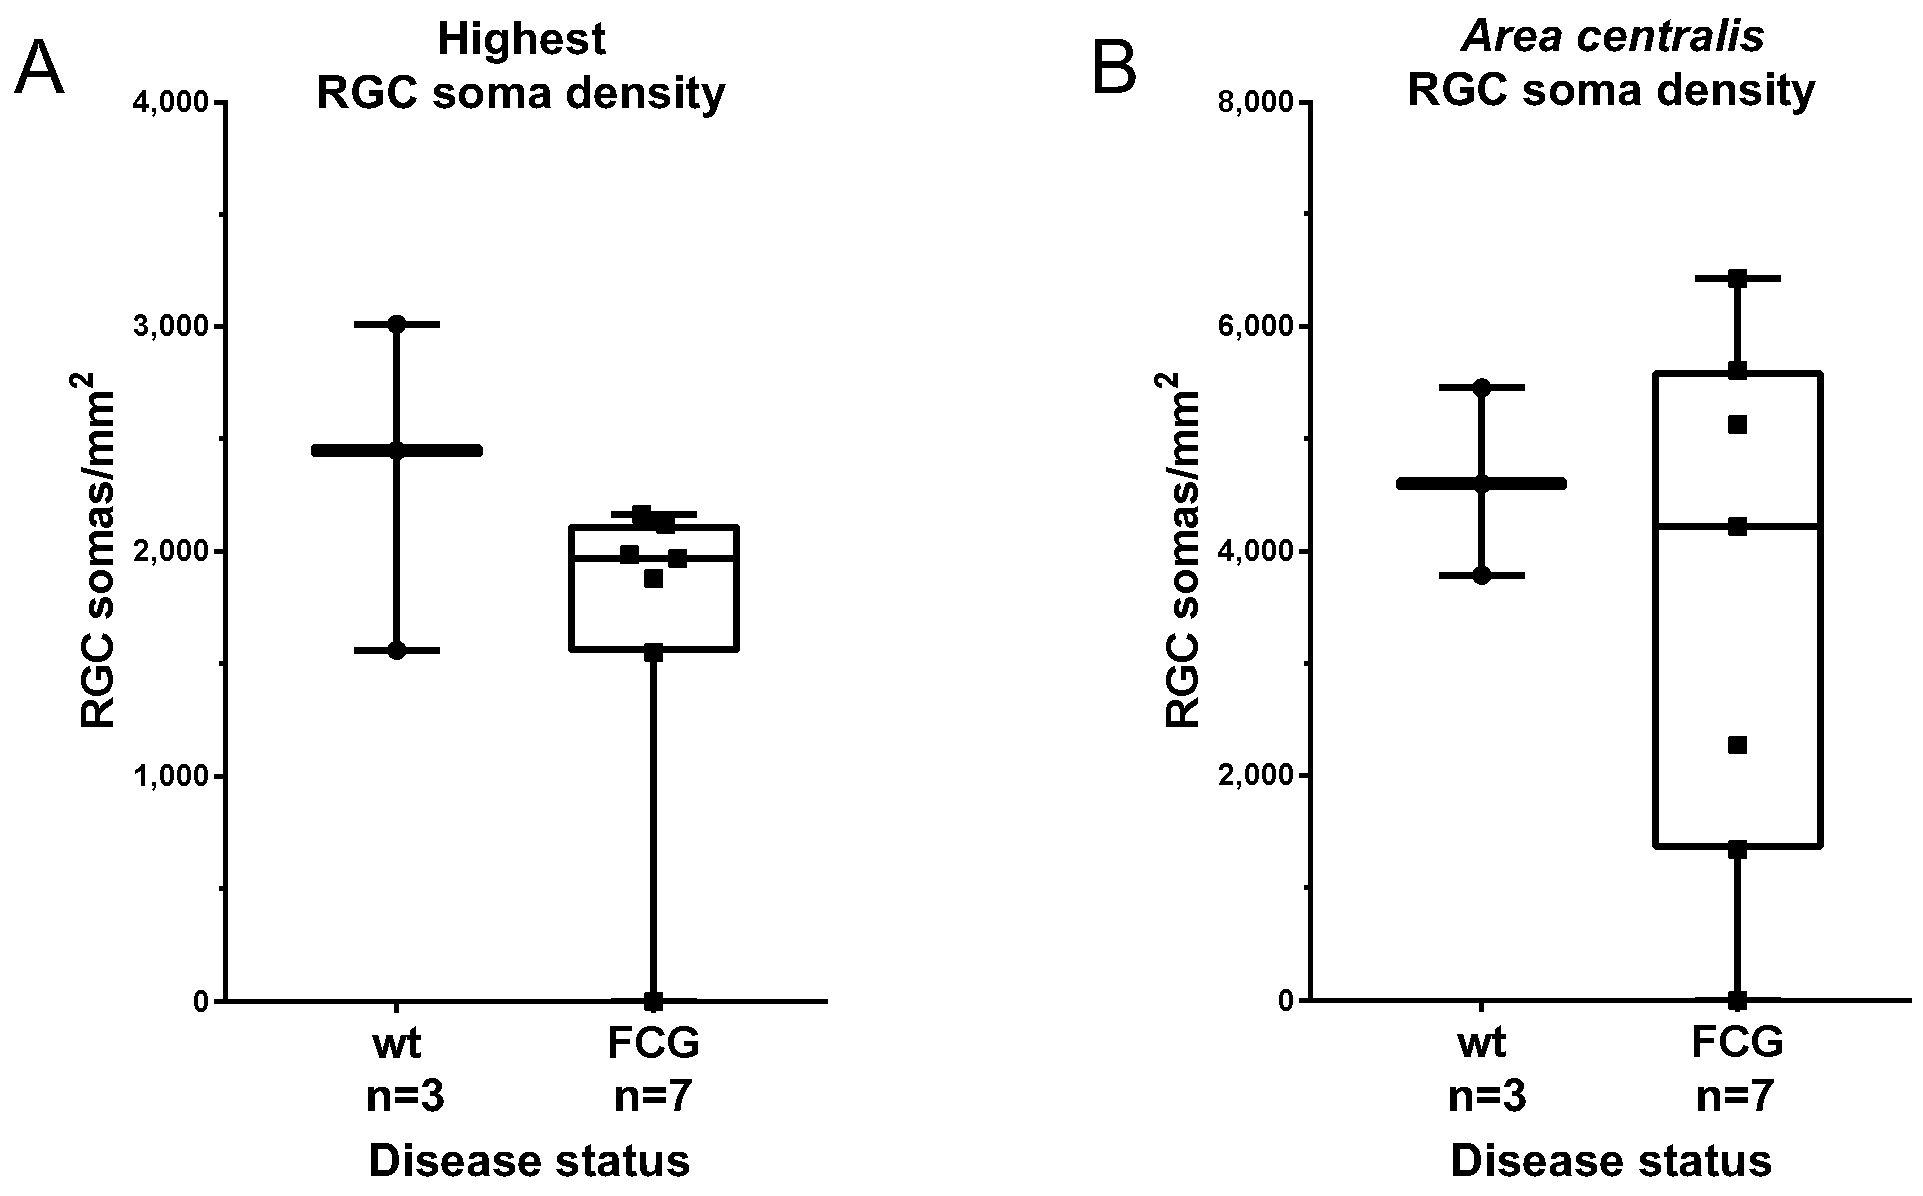
 Figure 4 of
Adelman, Mol Vis 2021; 27:608-621.
Figure 4 of
Adelman, Mol Vis 2021; 27:608-621.