Figure 3. Distribution of RGC densities in normal and glaucomatous feline retinas. A: Two-dimensional RGC soma isodensity plots (Retina package, R) for three normal, wild-type (wt) retinas (N1–3) and six feline
congenital glaucoma (FCG)-affected retinas (A1–4, A6–7). Regions of higher soma density are represented by warmer colors.
Note that the scales assigned to these colors differ between individual retinas. The nasal to temporal visual streak (black
arrows, N3) and the area centralis (black arrowhead, N3) are the regions of highest RGC soma density in most normal and FCG-affected
retinas. “S,” “T,” “I,” and “N” represent superior, temporal, inferior, and nasal aspects of the retina, respectively. Photomicrographs
are also shown of corresponding p-phenylenediamine (PPD)-stained optic nerve cross-sections with their RGC axon counts. [Scale
bar = 500 µm; N/A = not available because of tissue damage or loss during processing (A7 ON photomicrograph) or relief cut
placement (A5 isodensity plot).] B: Linear regression model of total RGC soma versus axon count in three normal wt eyes (N1–3) and six FCG-affected eyes (A1–6).
There is a strong correlation (R2 = 0.88) between total RGC soma and axon counts. C: Linear regression model of total RGC soma versus axon count in 6 FCG-affected eyes. There is a strong correlation (R2 = 0.92) between total RGC soma and axon counts within the FCG-affected retinas.
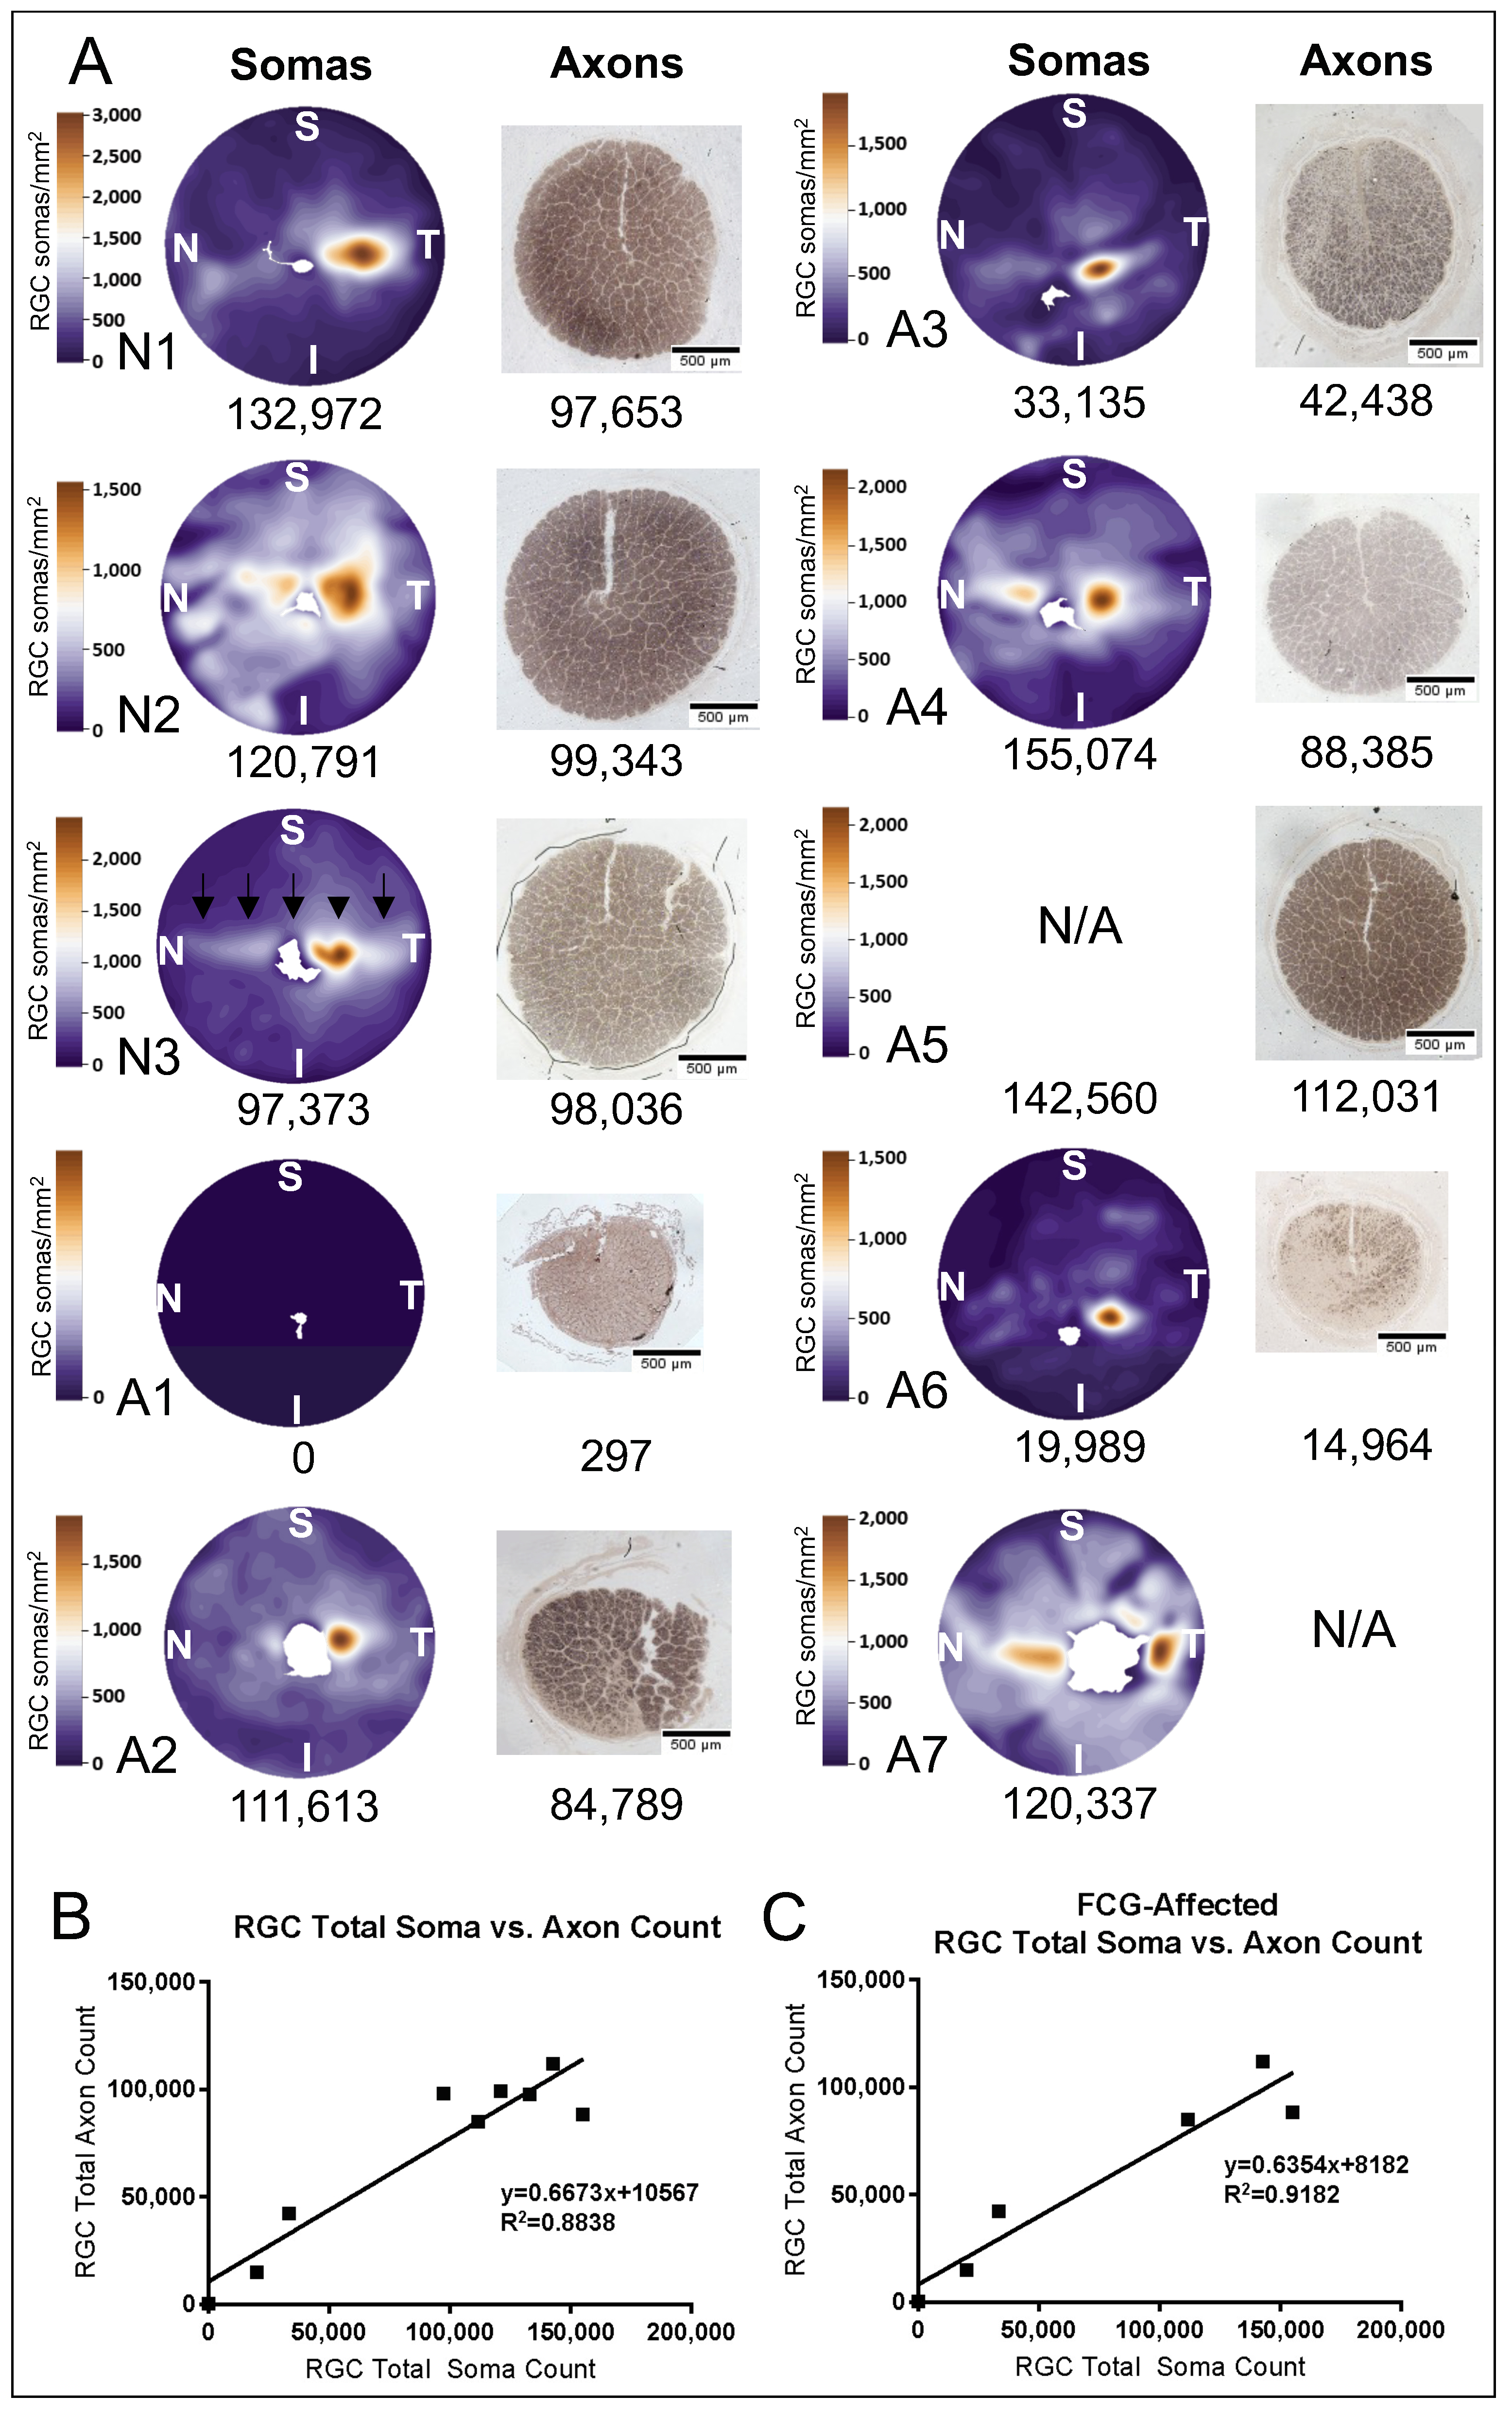
 Figure 3 of
Adelman, Mol Vis 2021; 27:608-621.
Figure 3 of
Adelman, Mol Vis 2021; 27:608-621.