Figure 2. Box-and-whisker plots of mean wild-type (wt) and feline congenital glaucoma (FCG)-affected (A) total RGC soma counts (N1–3, A1–7) and (B) total RGC axon counts (N1–3, A1–6). The whiskers represent the range of values, and each data point represents the total
count for an individual retina/subject. An axon count was not available (N/A) for A7 due to tissue loss during processing.
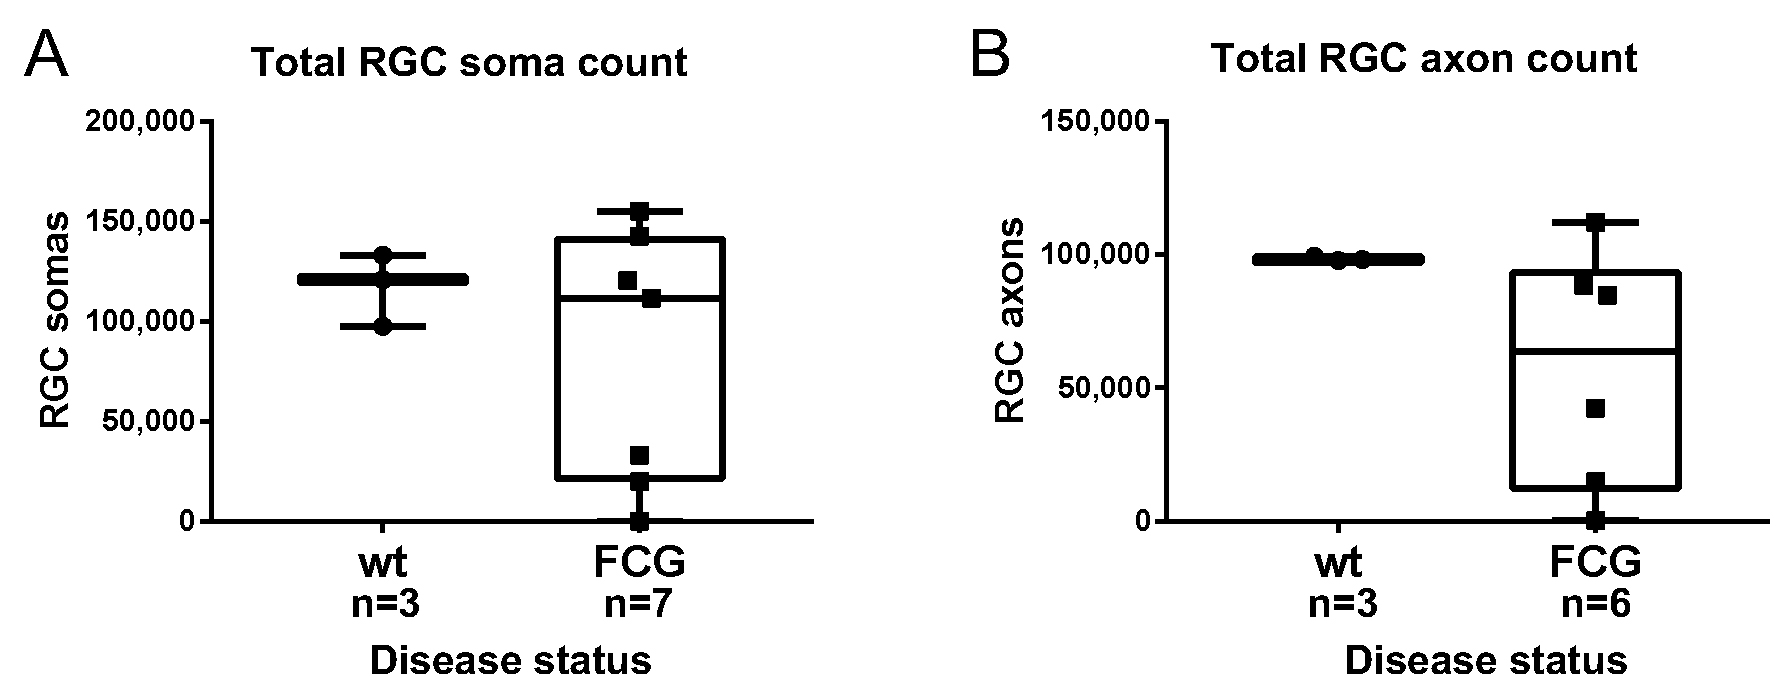
 Figure 2 of
Adelman, Mol Vis 2021; 27:608-621.
Figure 2 of
Adelman, Mol Vis 2021; 27:608-621.