Figure 2. The figure shows the variation in the levels of L-glutamate in the A) aqueous humor, B) plasma of patients with primary open angle (POAG) and primary angle closure (PACG) glaucoma compared to the control (cataract)
group, and C) linear correlation analysis of the aqueous humor and plasma L-glutamate levels collected among the same patients in this
study.
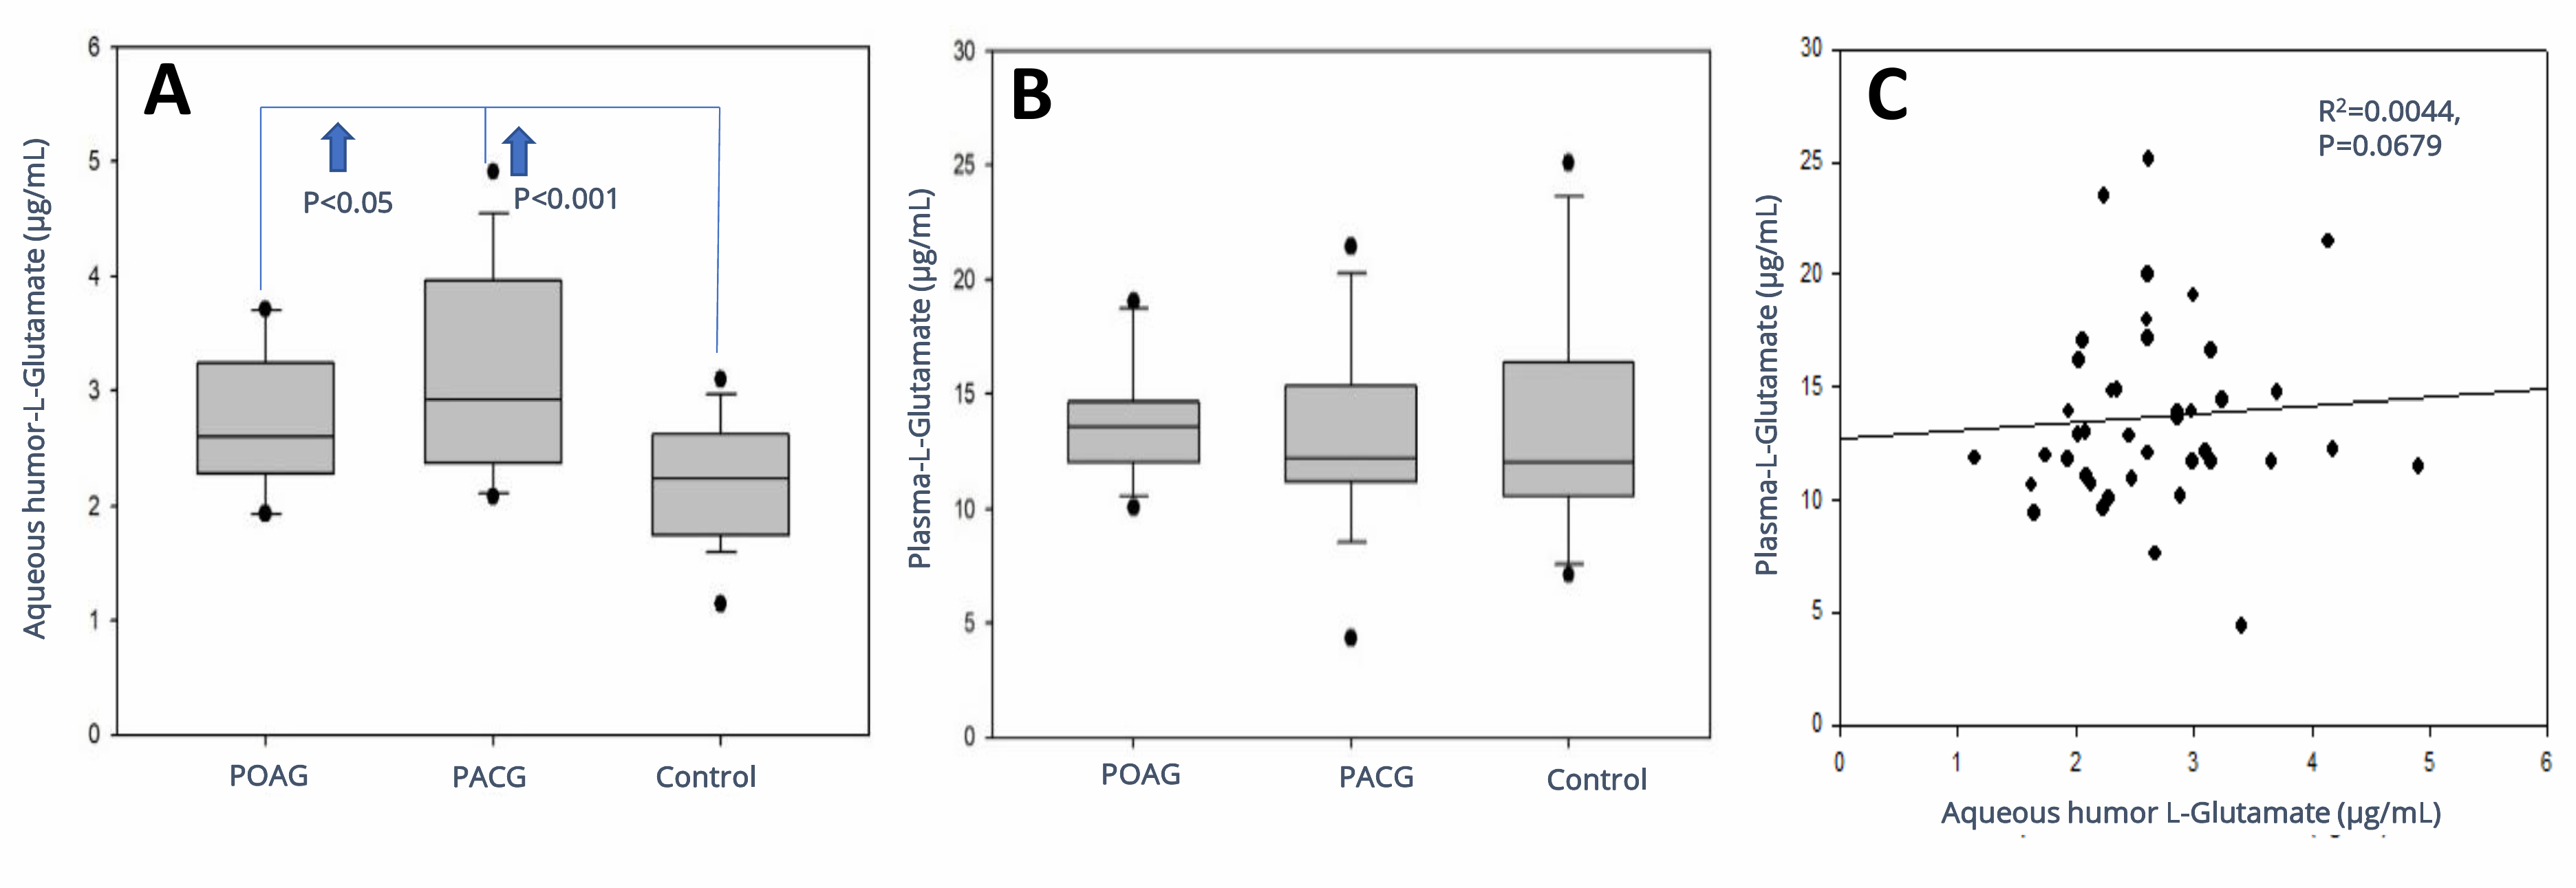
 Figure 2 of
Gowtham, Mol Vis 2021; 27:564-573.
Figure 2 of
Gowtham, Mol Vis 2021; 27:564-573.