Figure 5 of
Small, Mol Vis 2021; 27:518-527.
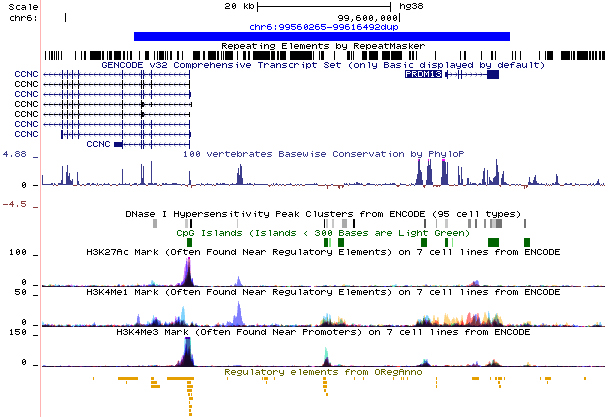
Figure 5.
UCSC tracks for the identified duplication. The duplication is represented by the blue bar. It overlaps with several DNase I sites (in gray) and multiple candidate
cis-
regulatory elements (NCBI functional elements and ORegAnno).
 Figure 5 of
Small, Mol Vis 2021; 27:518-527.
Figure 5 of
Small, Mol Vis 2021; 27:518-527.