Figure 6. qRT-PCR analysis of myosin IIB, ACTIN3, RAP1A, and RhoA in the control and FDM groups (A, B, C, D, n = 3, each group). Western blotting of myosin IIB and RhoA in the control and form-deprivation myopia (FDM) groups (E, F, G, H, n = 3, each group). Data are expressed as the mean ± standard deviation (SD). *p<0.05.
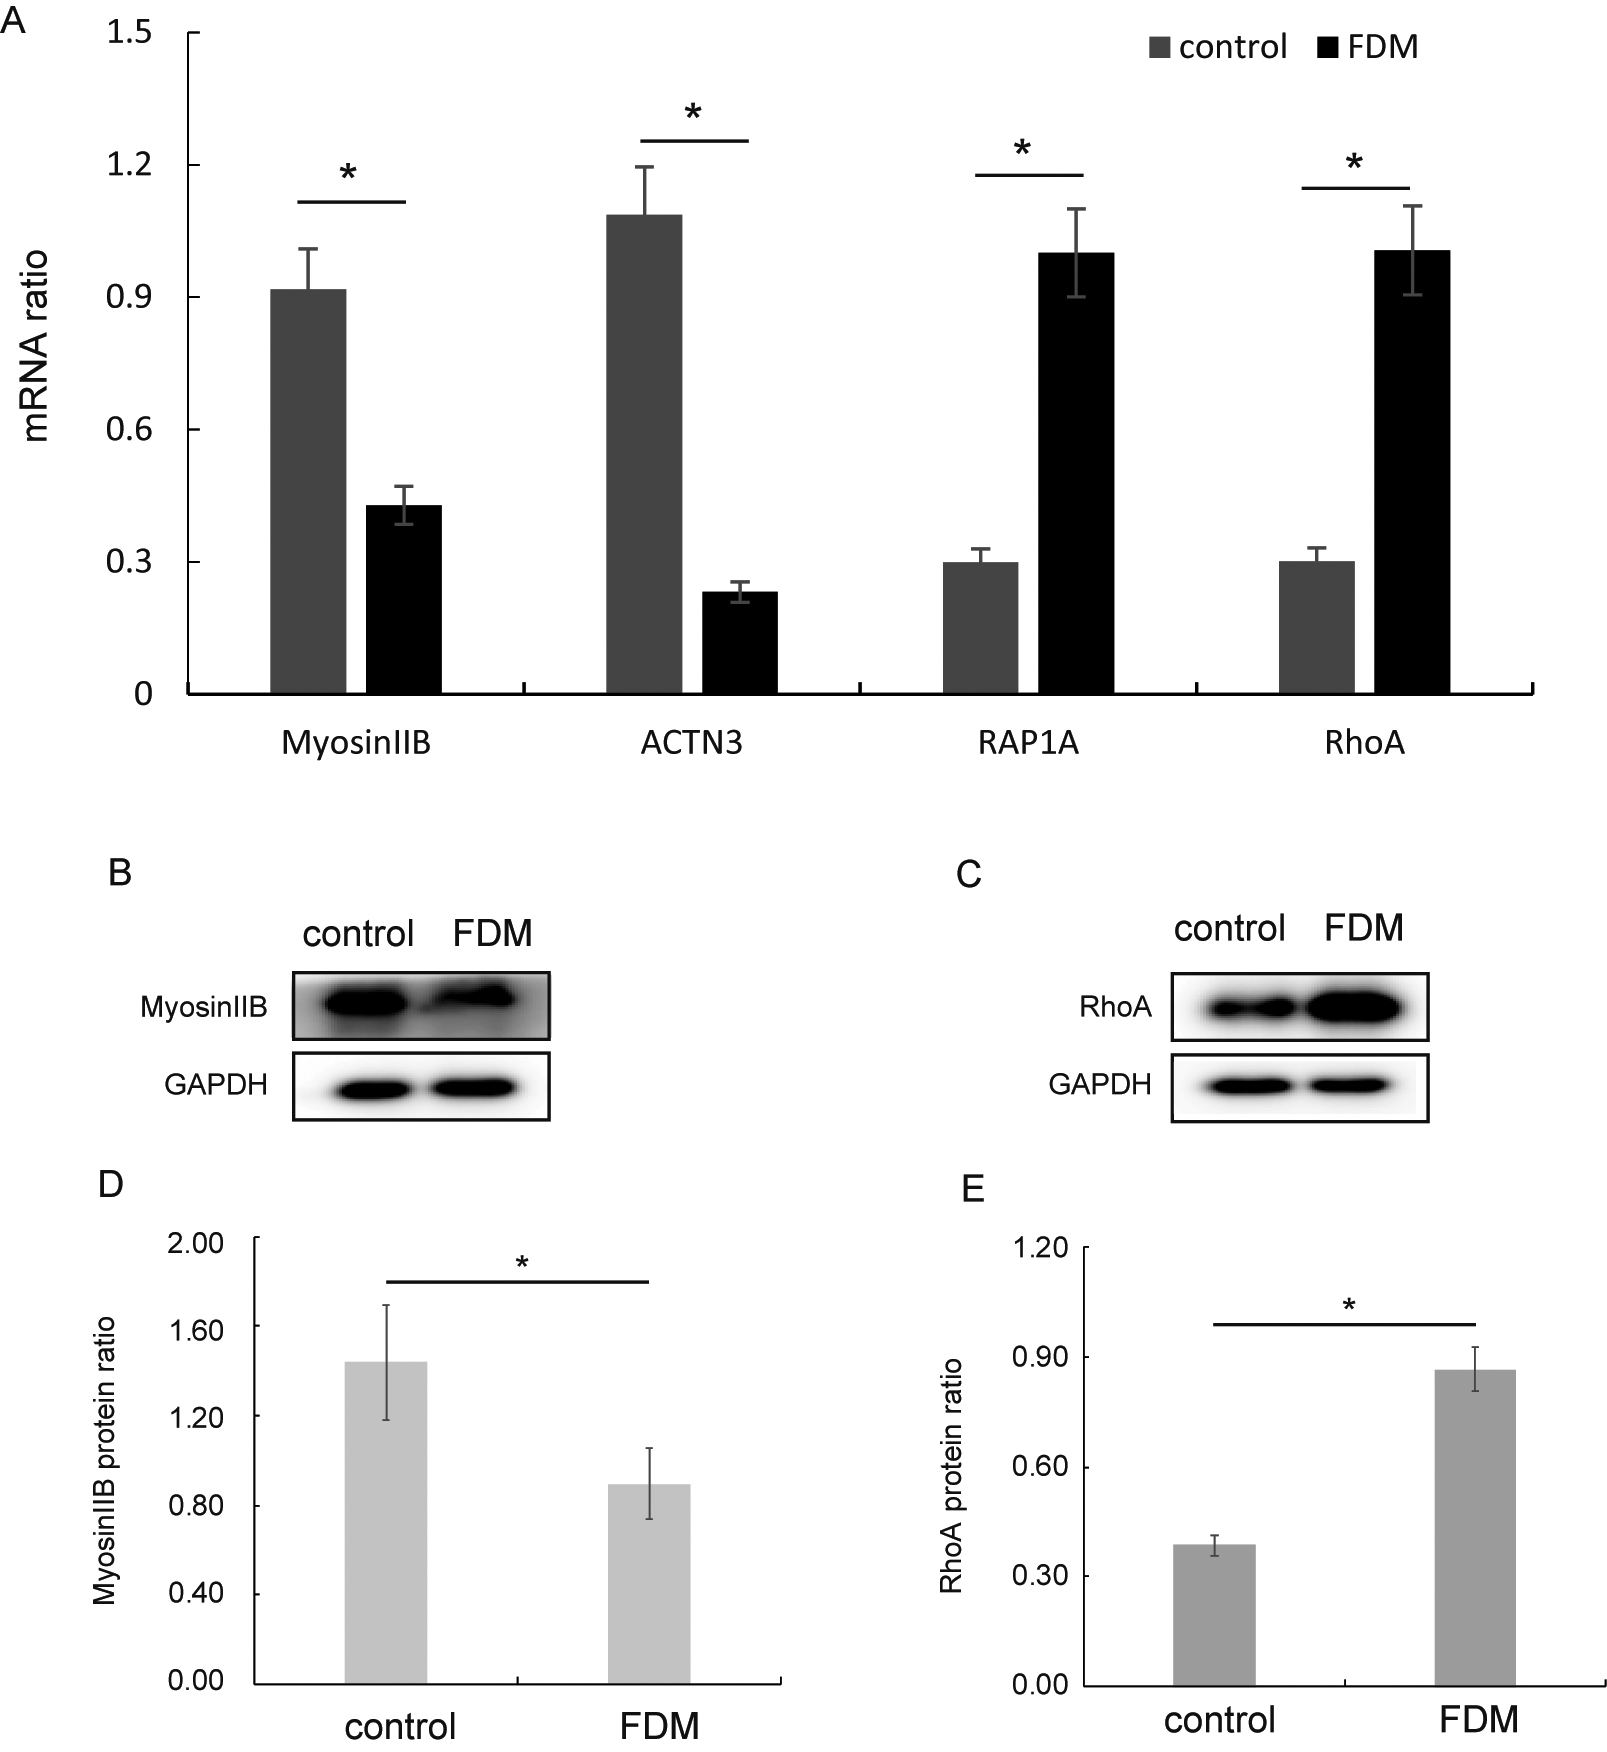
 Figure 6 of
Yuan, Mol Vis 2021; 27:494-505.
Figure 6 of
Yuan, Mol Vis 2021; 27:494-505.