Figure 4. Protein function and network analysis using IPA. A: The function and disease analysis of differently expressed proteins. B: The network of cellular movement and cellular assembly and organization. C: Organization of cytoskeleton, D: microtubule dynamics, E: formation of cytoskeleton, F: formation of filaments, G: fibrogenesis. Red representing the upregulation proteins and green representing the downregulation proteins.
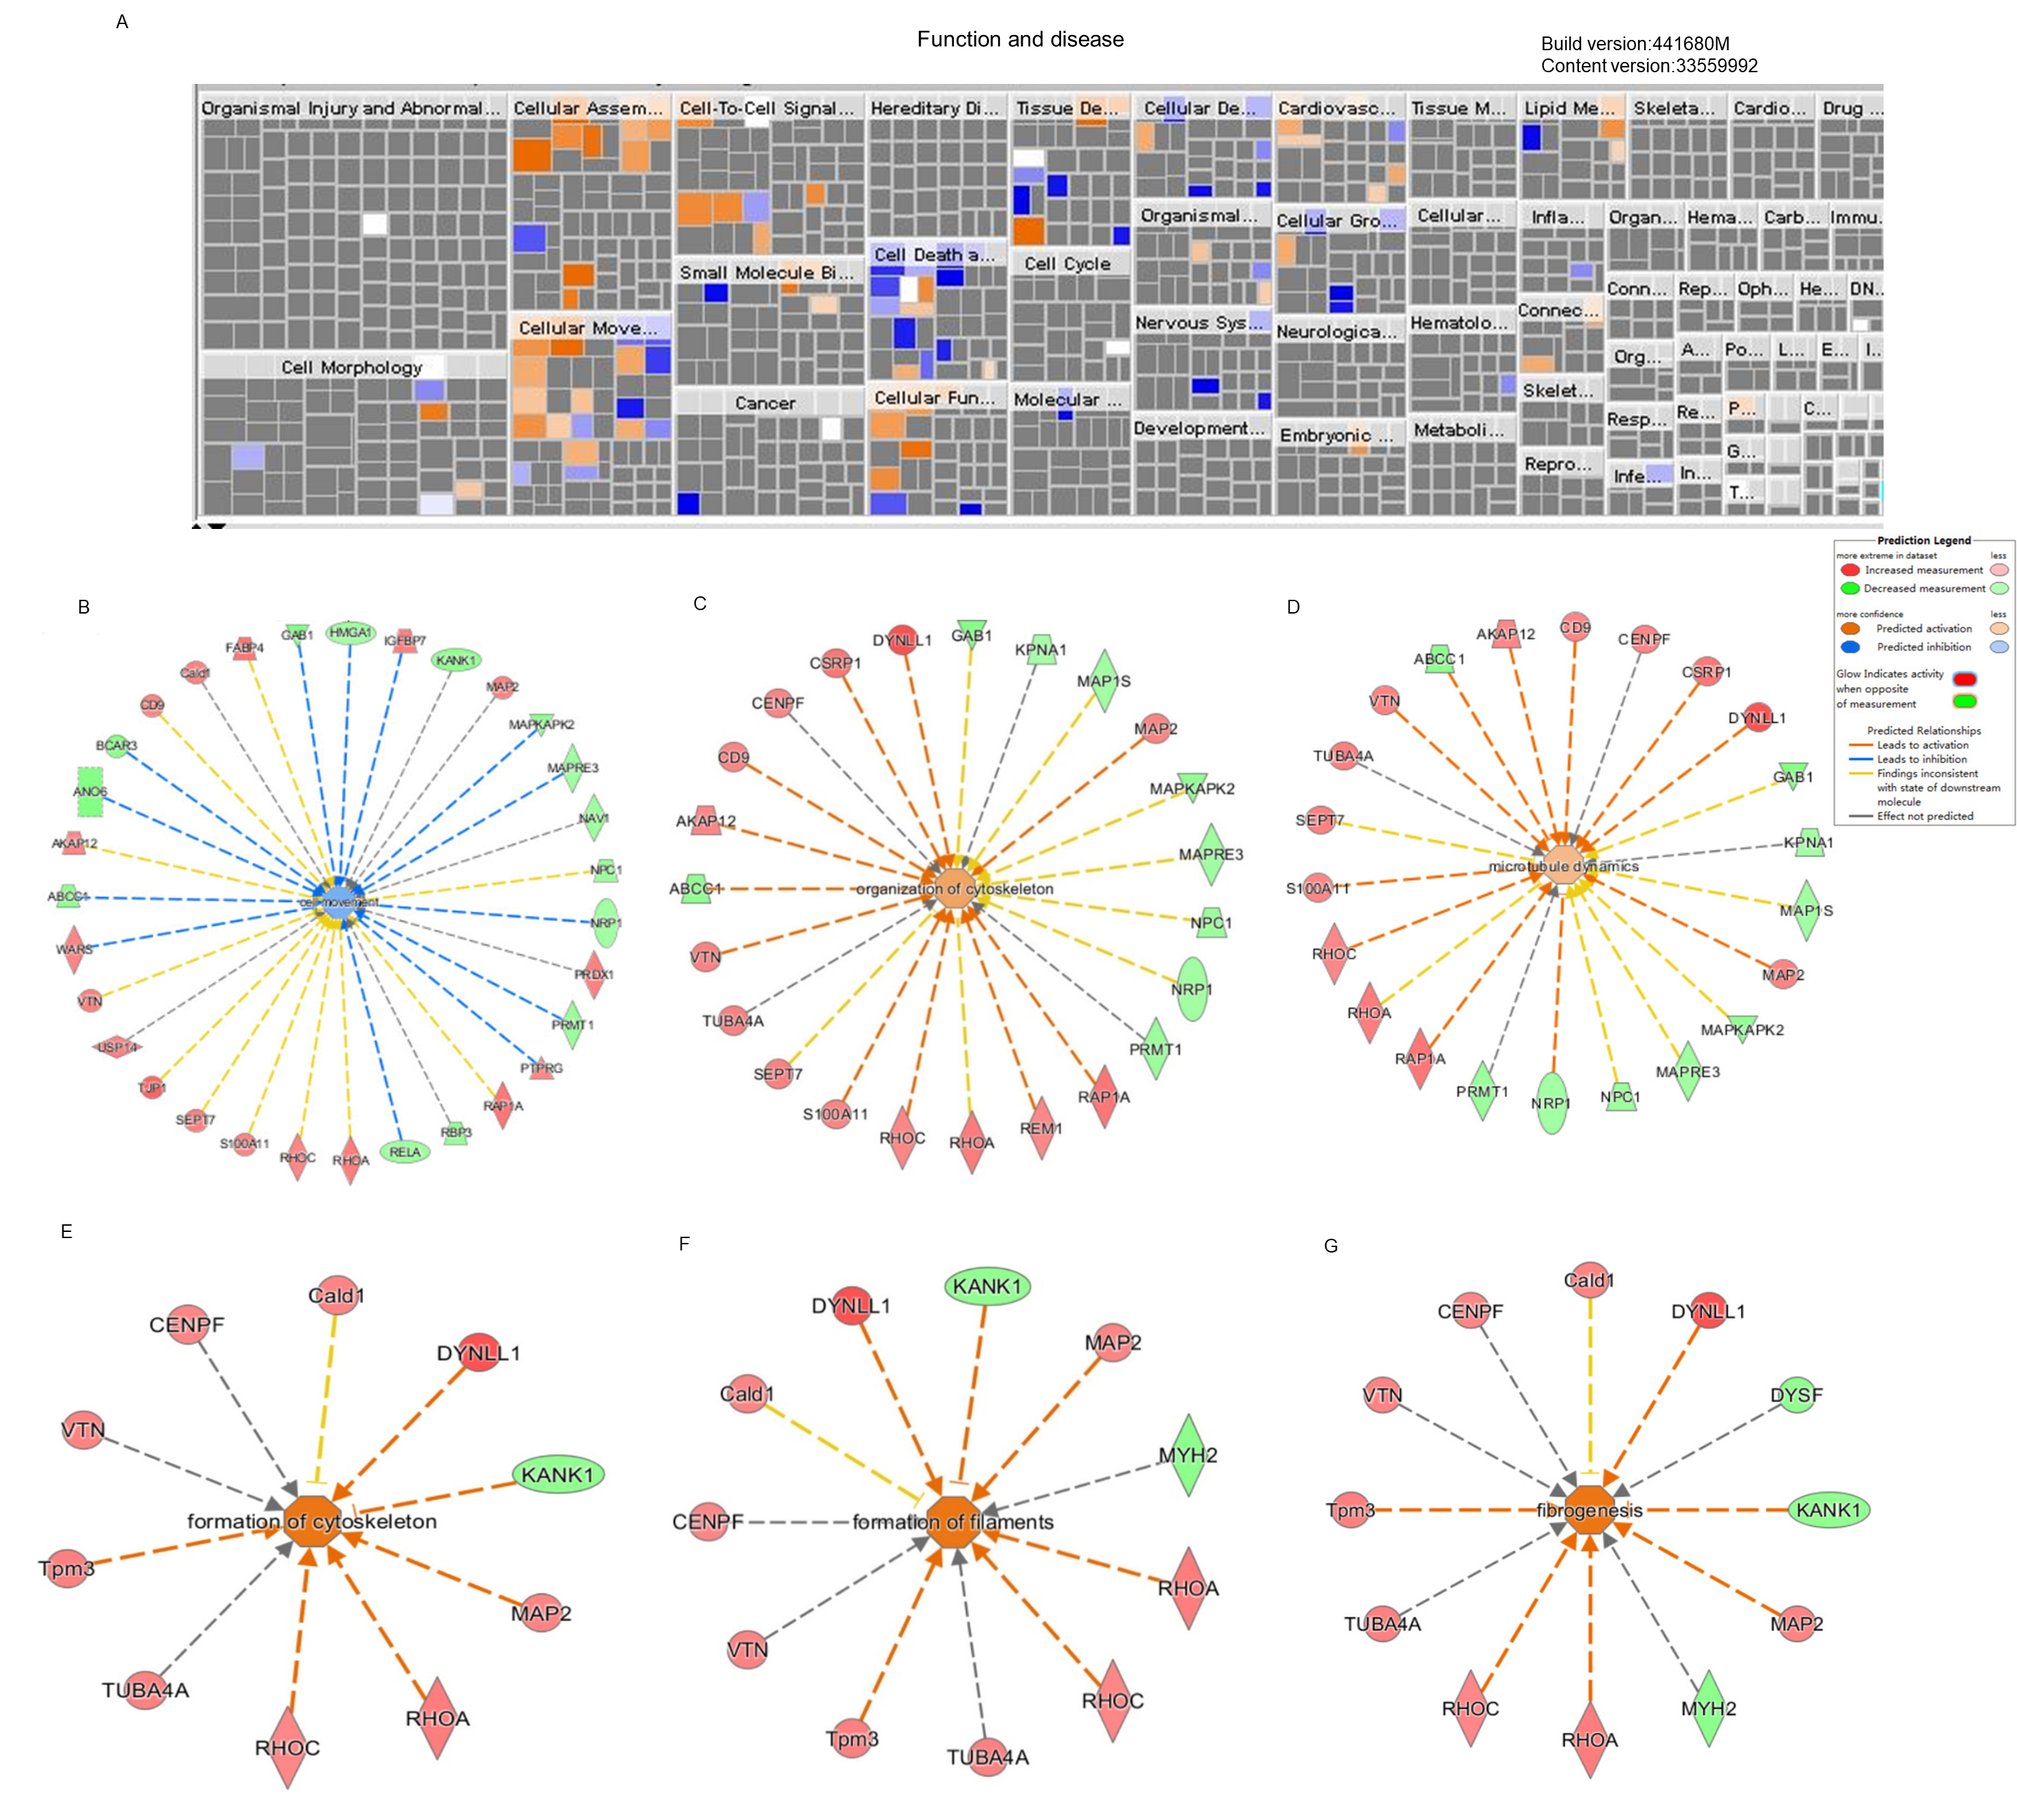
 Figure 4 of
Yuan, Mol Vis 2021; 27:494-505.
Figure 4 of
Yuan, Mol Vis 2021; 27:494-505.