Figure 2. Global protein expression patterns in guinea pig sclera. A: Hierarchical clustering representation of total 140 differently expressed proteins. The magnitude of the percentage is represented
by a color scale (top left) from low (blue) to high (red). B: Volcano plots representing the distribution of significance and fold change of differently expressed proteins in the form-deprivation
myopia (FDM) group compared to the control group. Vertical lines represent 1.2-fold up and down, respectively, and the horizontal
line corresponds to a p value of 0.05 (n = 3, each group).
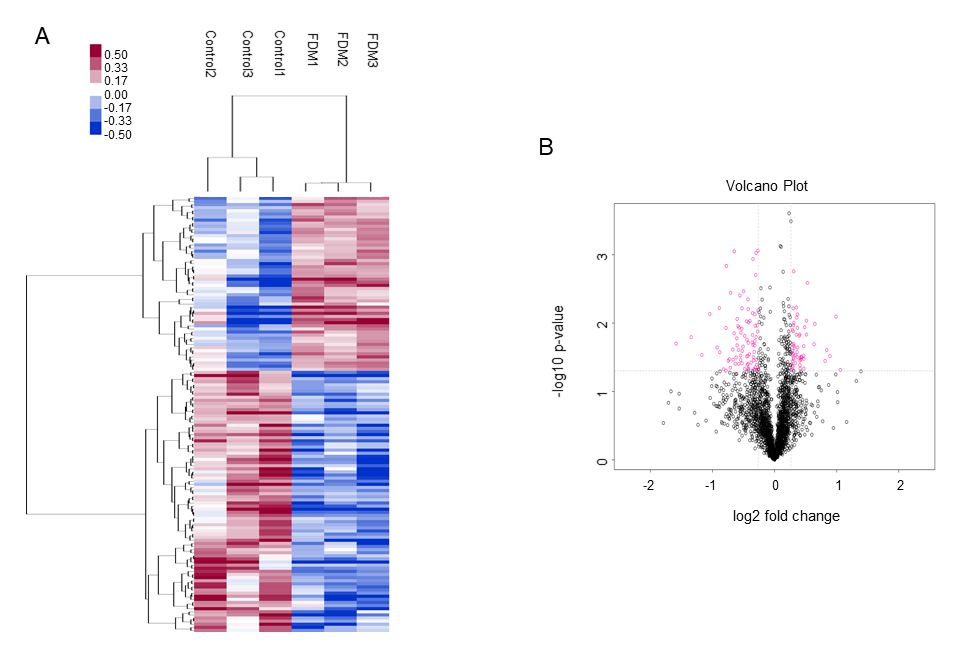
 Figure 2 of
Yuan, Mol Vis 2021; 27:494-505.
Figure 2 of
Yuan, Mol Vis 2021; 27:494-505.