Figure 1 of
Yuan, Mol Vis 2021; 27:494-505.
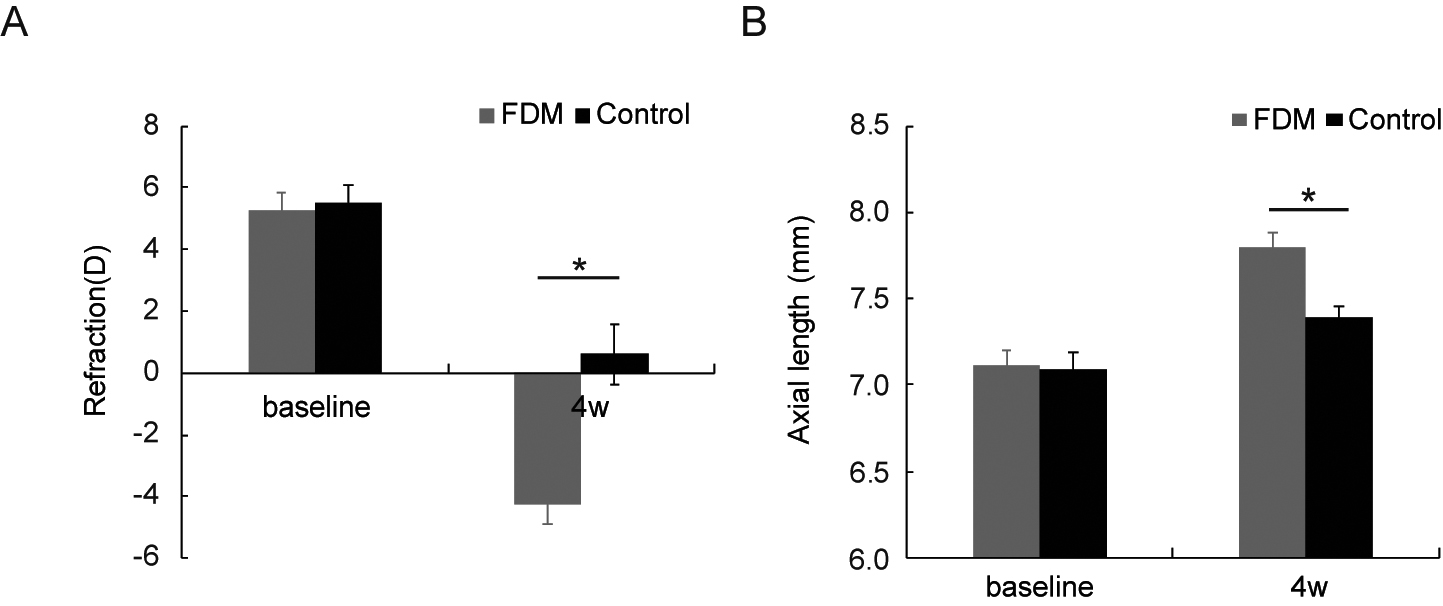
Figure 1.
Refraction and axial length in control and FDM groups at the beginning and end of the treatment.
A
: Refraction and (
B
) axial length (n = 9, each group). Data are expressed as the mean ± standard deviation (SD). *p<0.05.
 Figure 1 of
Yuan, Mol Vis 2021; 27:494-505.
Figure 1 of
Yuan, Mol Vis 2021; 27:494-505.