Figure 4. Fractal analysis of OCTA images. A: The raw OCTA image used for analysis. B: Annular zone (0.6–5.0 mm) for fractal analysis of vascular density in 6 x 6 mm2 OCTA images. C: Image processing after four quadrant zones were generated after removing the FAZ (diameter = 0.6 mm). ST, superior temporal;
SN, superior nasal; IT, inferior temporal; IN, inferior nasal. D:The annular zone was divided into six annuli (C1–C6, centered
on the fovea), with a bandwidth of 0.37 mm after removing the FAZ. Scale bar: 1 mm.
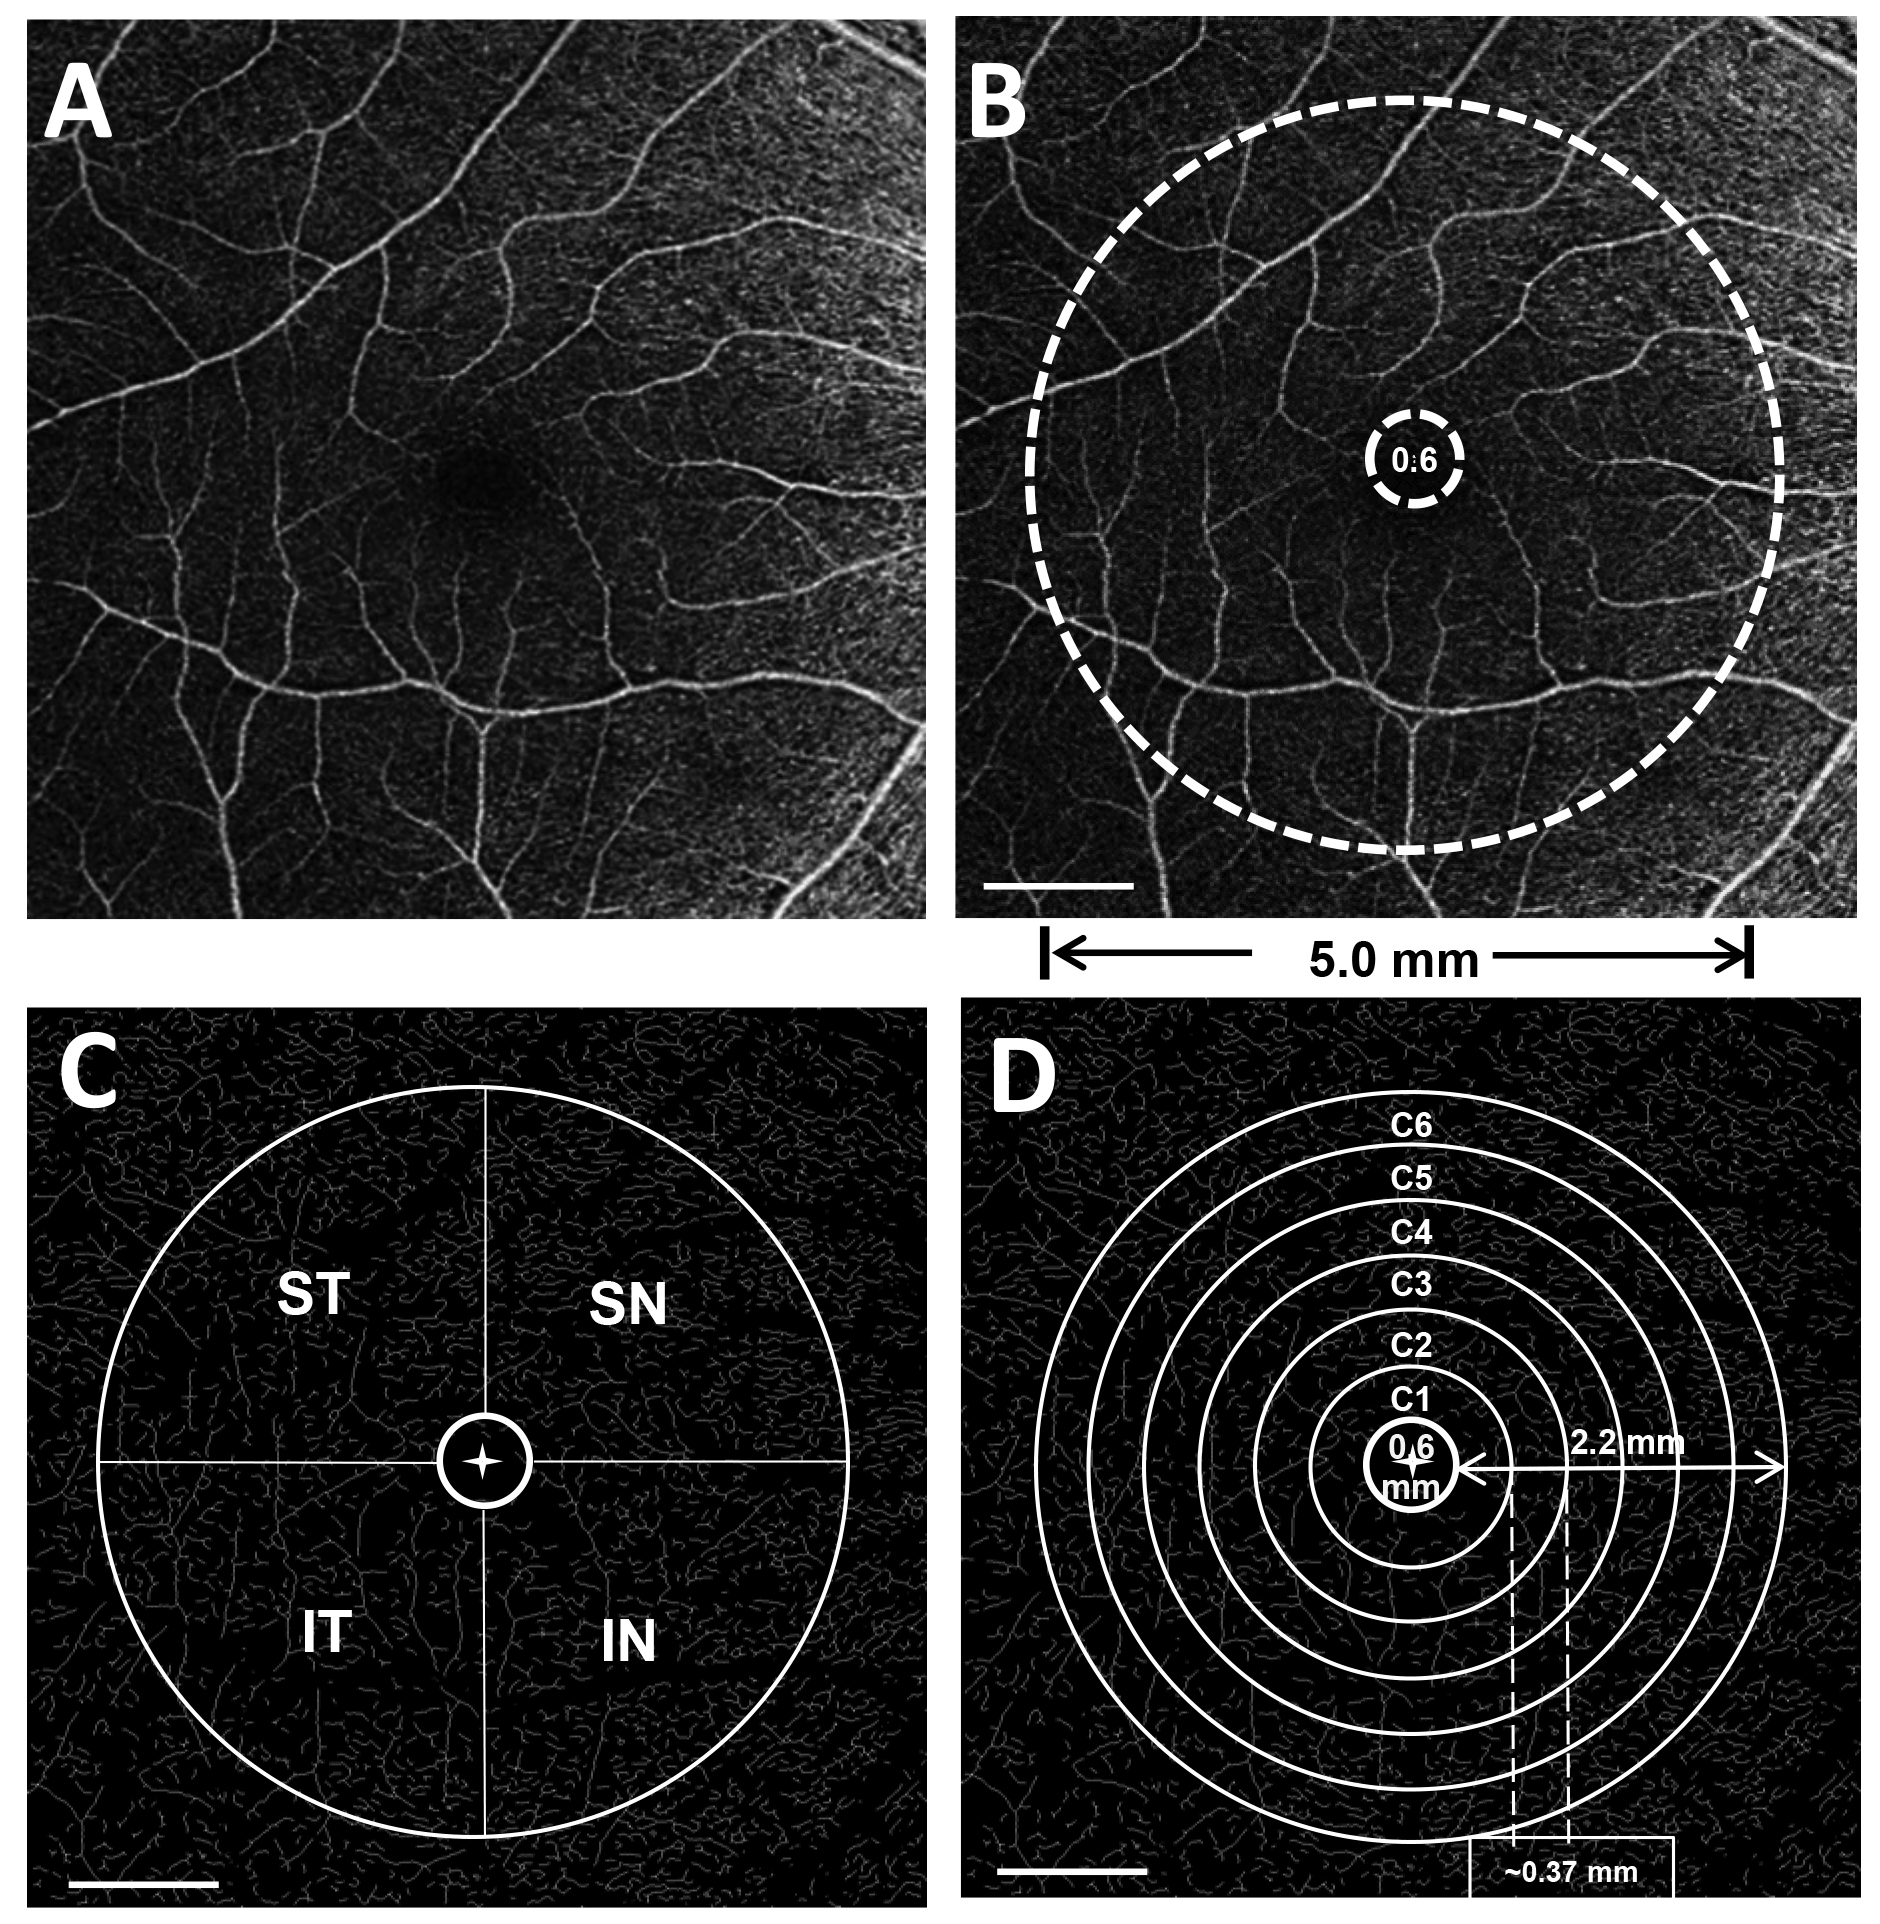
 Figure 4 of
Hu, Mol Vis 2021; 27:466-479.
Figure 4 of
Hu, Mol Vis 2021; 27:466-479.