Figure 2. The number of individuals diagnosed with a specific entity and the wait time for the diagnosis. The box plot for each phenotype
is divided into two differently shaded parts with the median value between them (in years). Each data point represents a patient.
ACHM, achromatopsia; CD/CRD, cone or cone-rod dystrophy; CSNB, congenital stationary night blindness; Leber congenital amaurosis,
RP, retinitis pigmentosa; STGD, Stargardt disease.
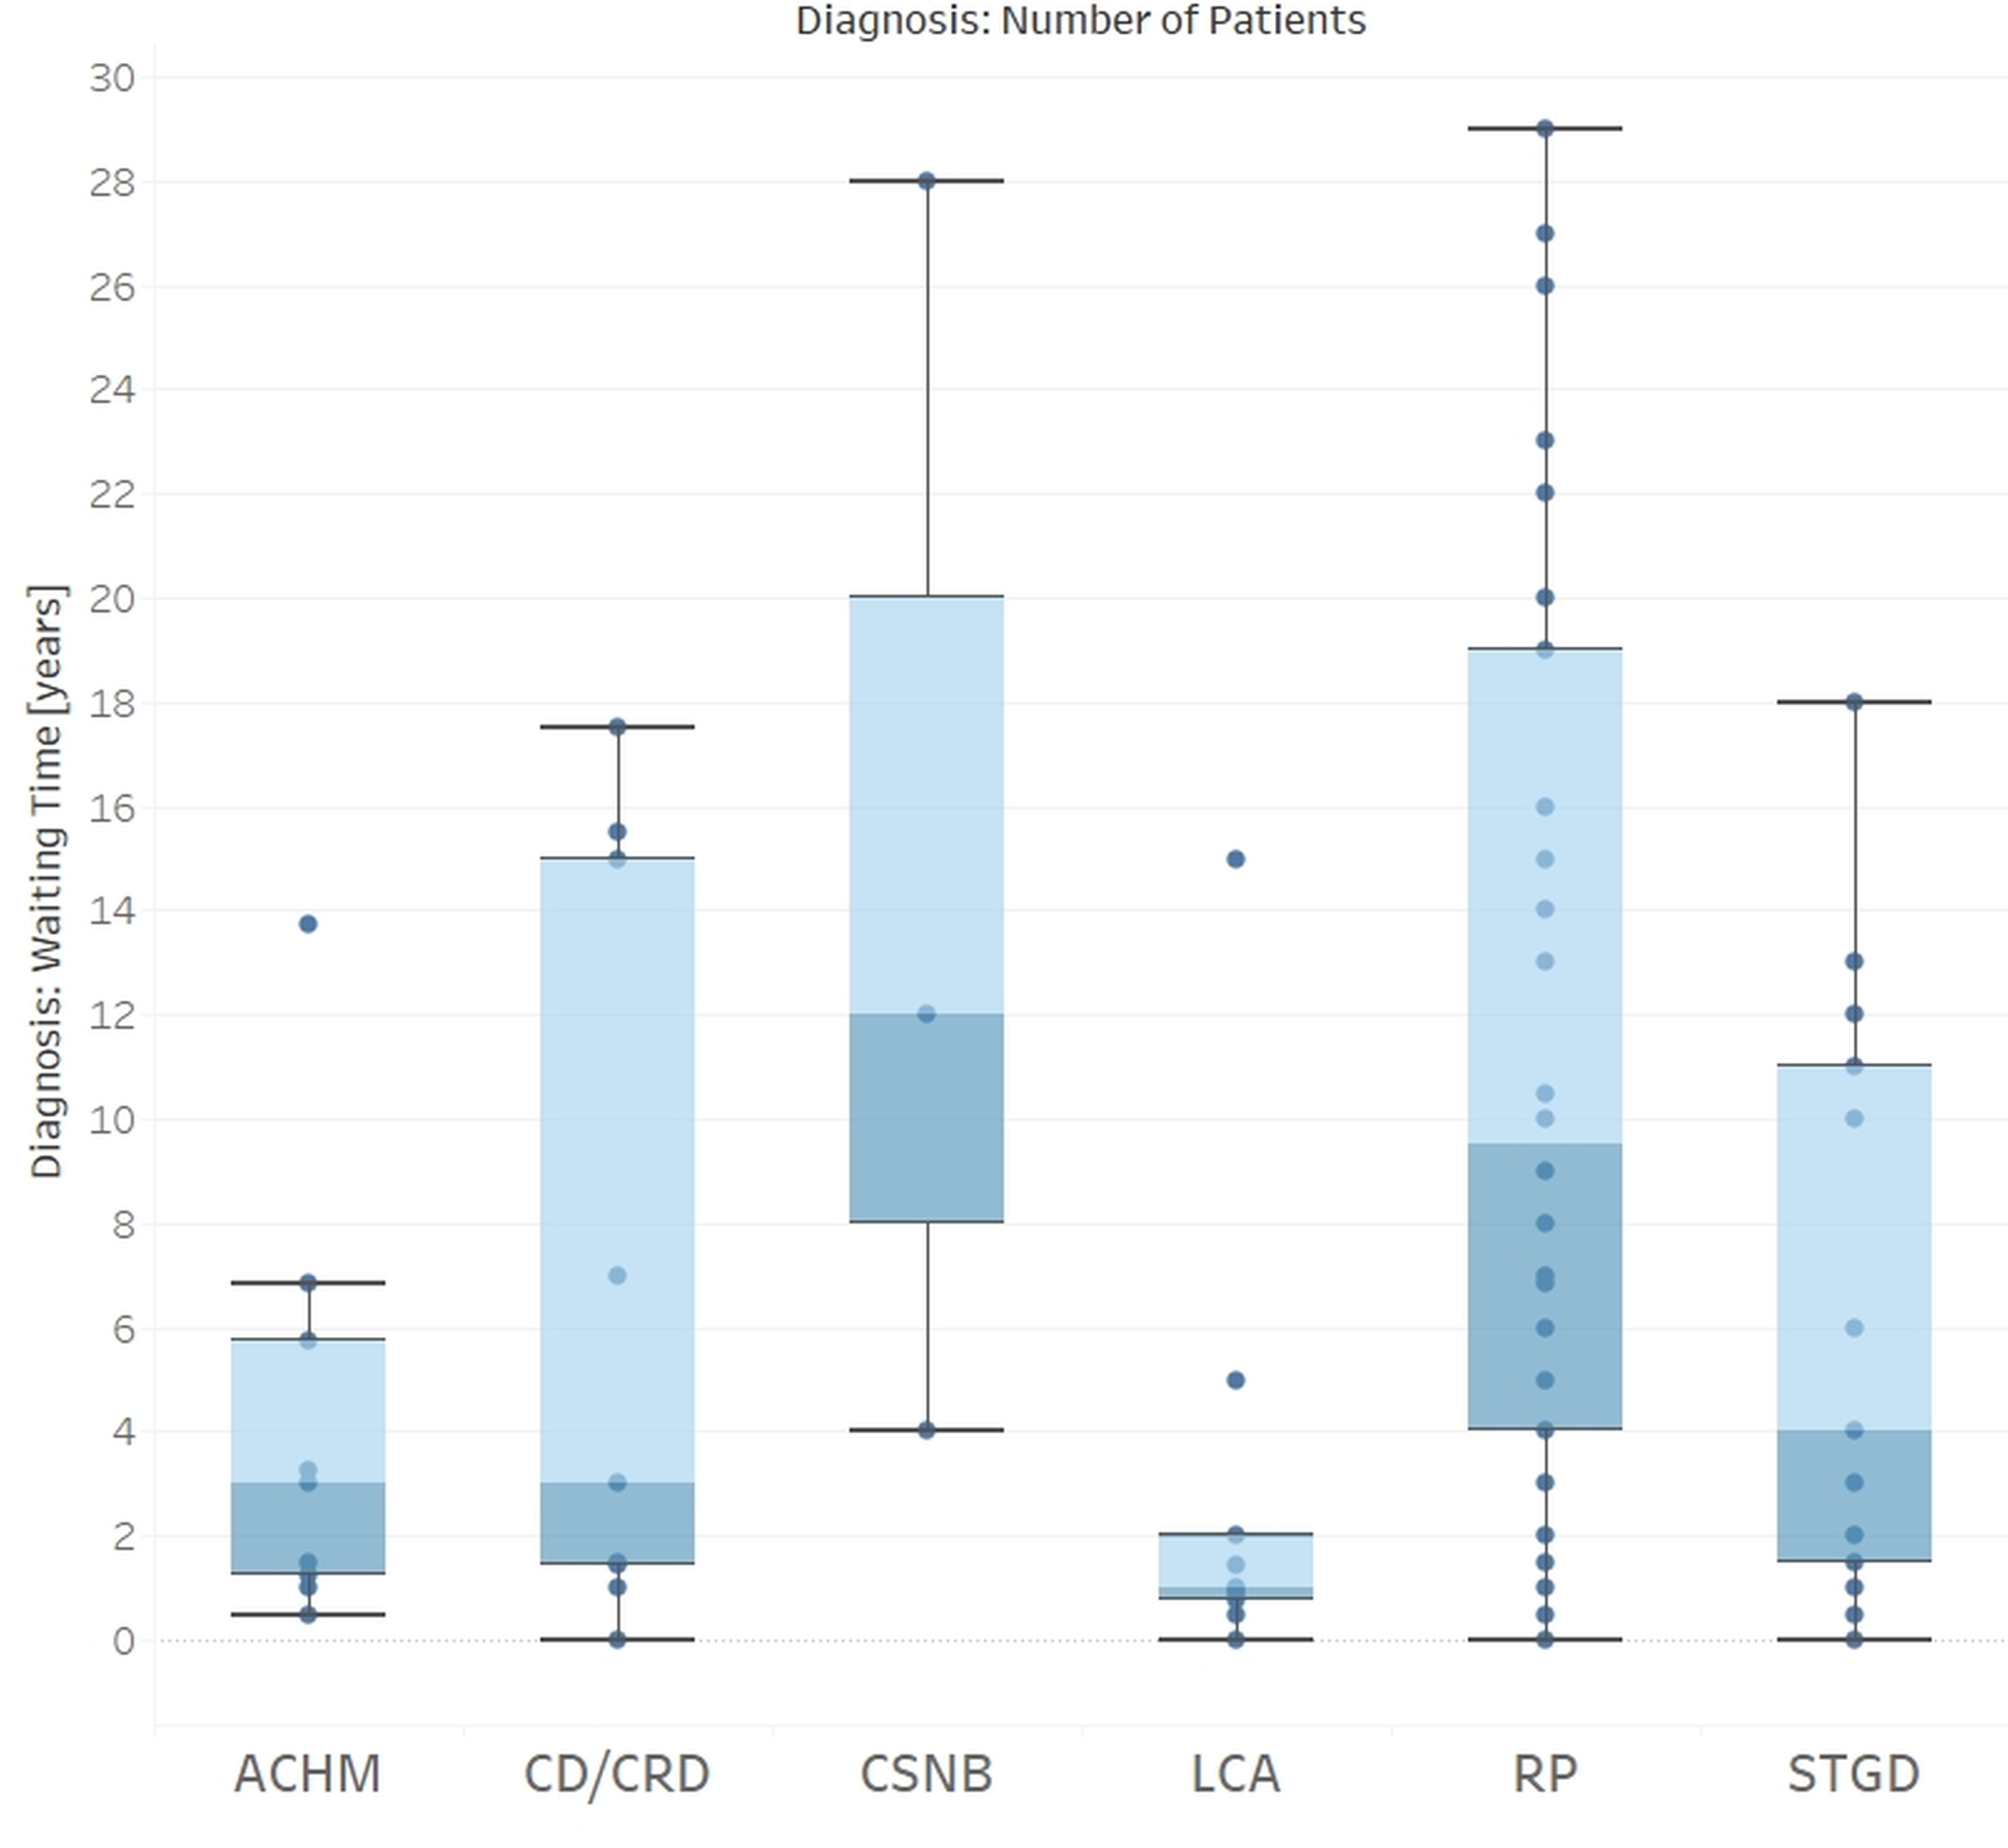
 Figure 2 of
Tracewska, Mol Vis 2021; 27:457-465.
Figure 2 of
Tracewska, Mol Vis 2021; 27:457-465.