Figure 8. TUNEL assay results of the non-minocycline treatment group and the minocycline treatment group at 12 h and 24 h after IR.
A–C: 12 h after ischemia-reperfusion (IR): (A) minocycline treatment (Mino) group, (B) no treatment (NT) group, and (C) sham group. D–F: 24 h after IR: D) Mino group, (E) NT group, and (F) positive control. We stained the cell nuclei with 4',6-diamidino-2-phenylindole (DAPI; blue) and Terminal deoxynucleotidyl
transferase biotin-dUTP nick end labeling (TUNEL)-positive retinal cells with fluorescein isothiocyanate (FITC; green). The
lower left part of each image indicates only the TUNEL-positive retinal cells. The number of TUNEL-positive retinal cells
in the Mino group (A and D) at 12 h and 24 h was much lower than in the NT group (B and E). Scale bar: 20 μm. G: The average cell numbers of TUNEL-positive retinal cells for each visual field in each group (n = 6) at 12 h and 24 h after
IR. NT-12 h: NT group at 12 h; Mino-12 h: Mino group at 12 h; NT-24 h: NT group at 24 h; Mino-24 h: Mino group at 24 h. ***p<0.001;
**p<0.01.
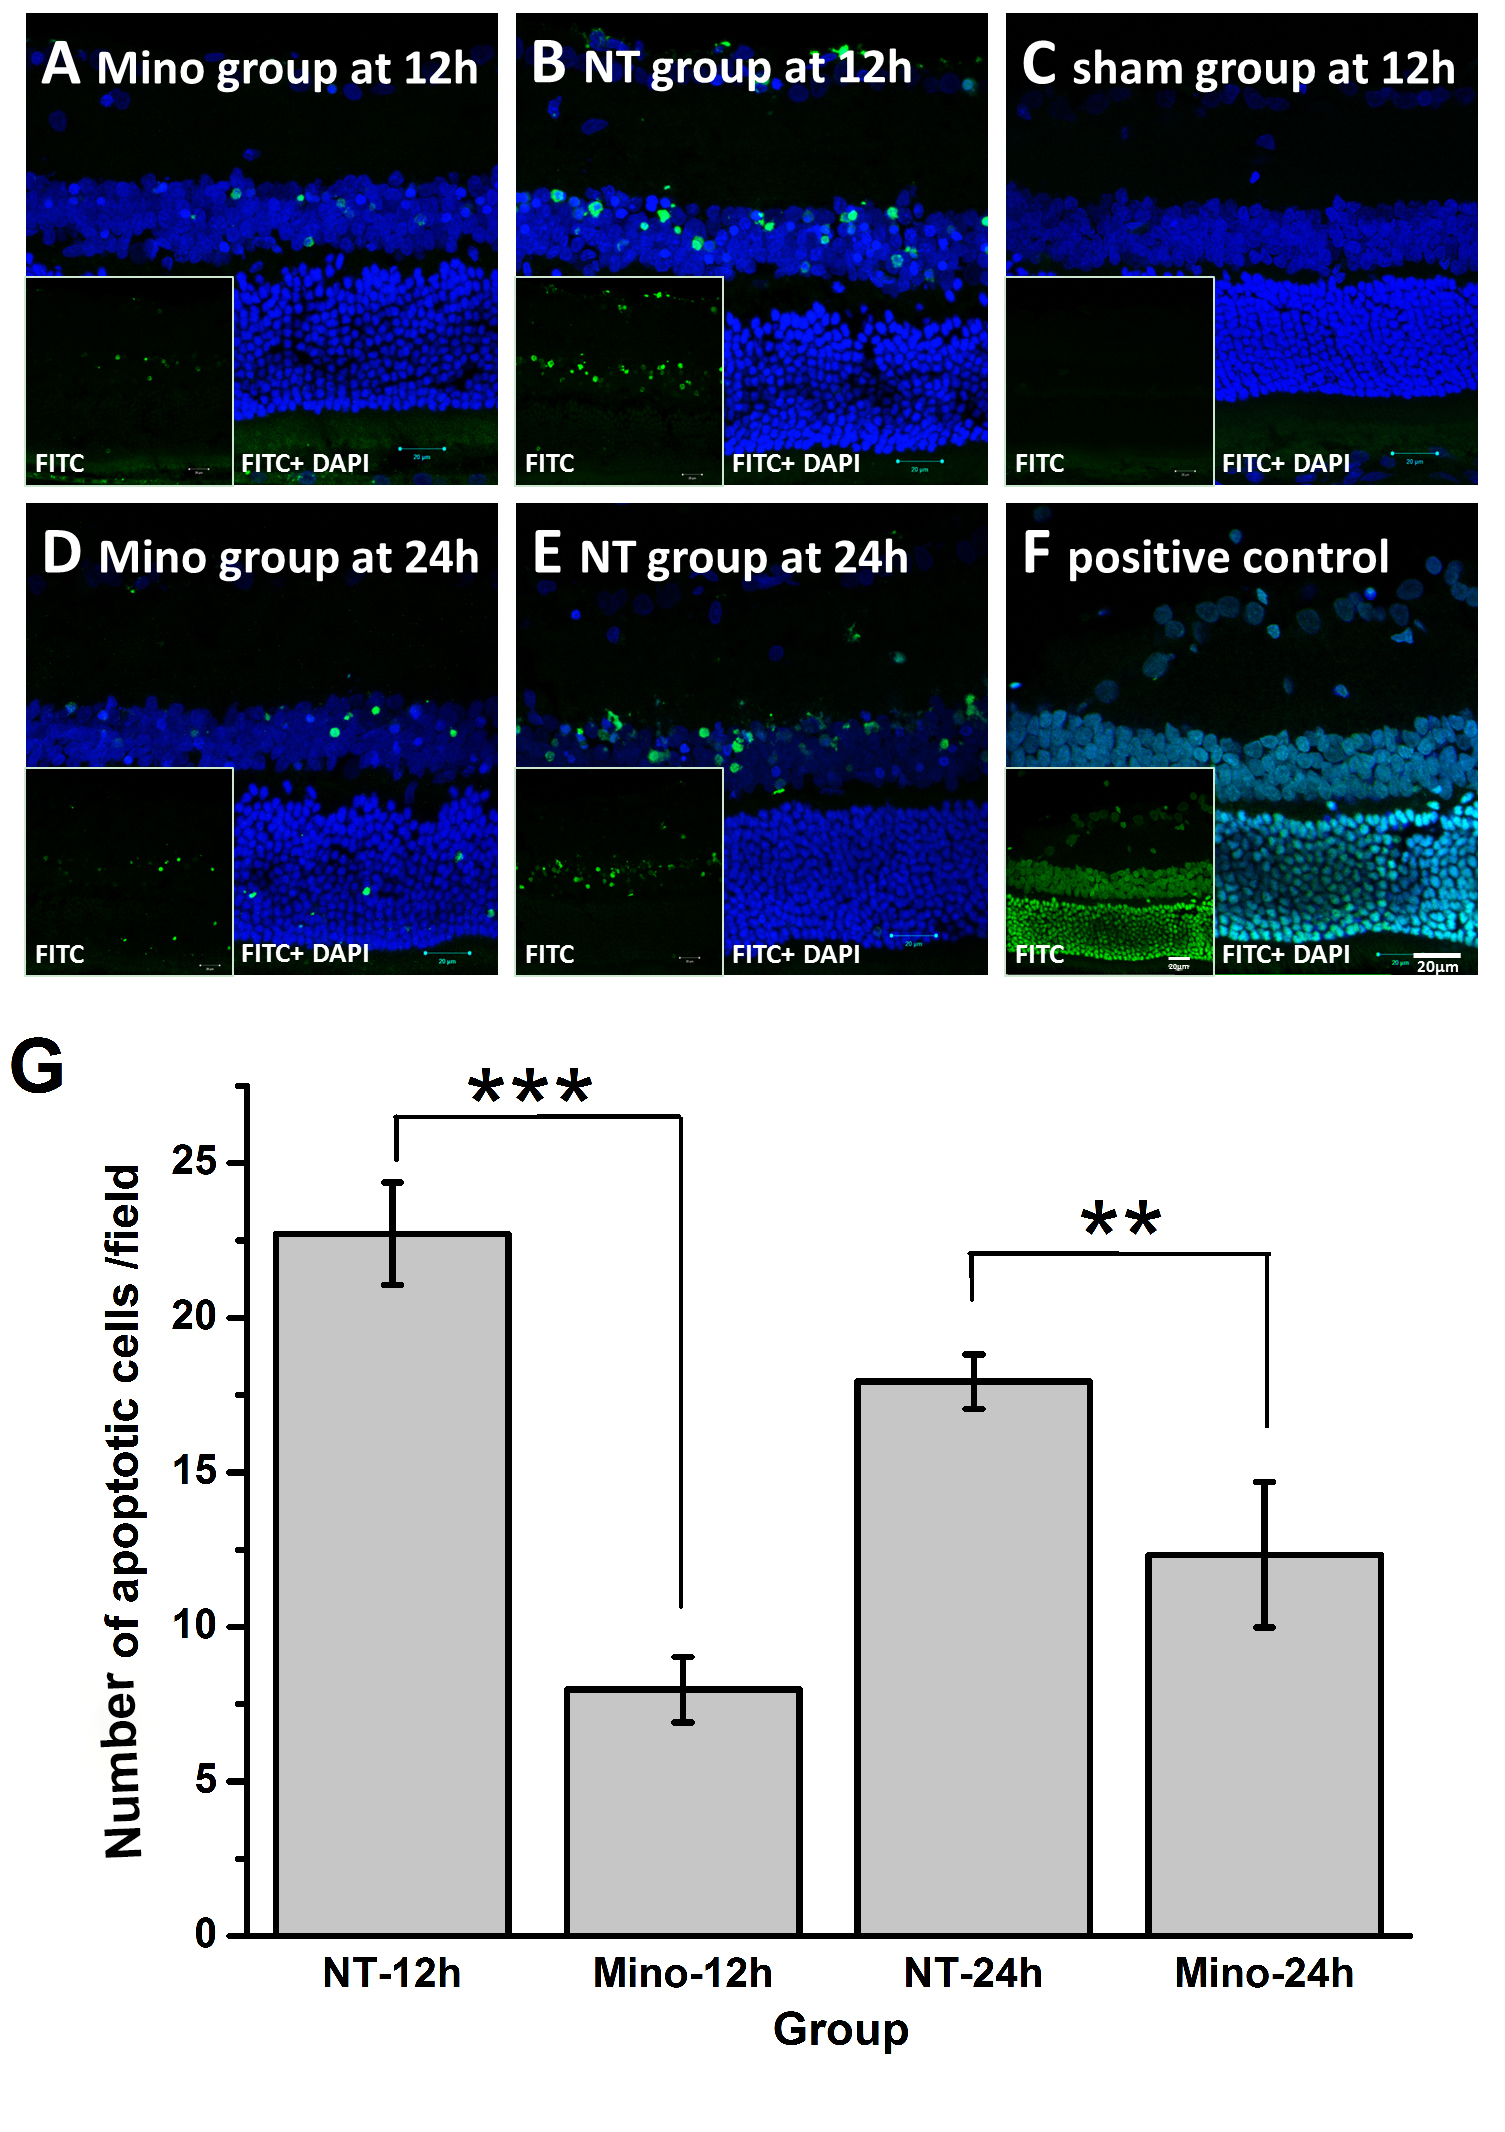
 Figure 8 of
Li, Mol Vis 2021; 27:438-456.
Figure 8 of
Li, Mol Vis 2021; 27:438-456.