Figure 5. The retinal thicknesses of different locations by measuring H&E staining and OCT photography of the sham group, the non-minocycline
treatment group, and the minocycline treatment group at 3 days and 14 days after IR. A, B: The retinal thickness with hematoxylin and eosin (H&E) staining. 12: 12 o’clock; 6: 6 o’clock. C, D: The retinal thickness with optical coherence tomography (OCT). B, bitemporal; N, nasal; U, up; D, down. n = 6. ***p<0.001.
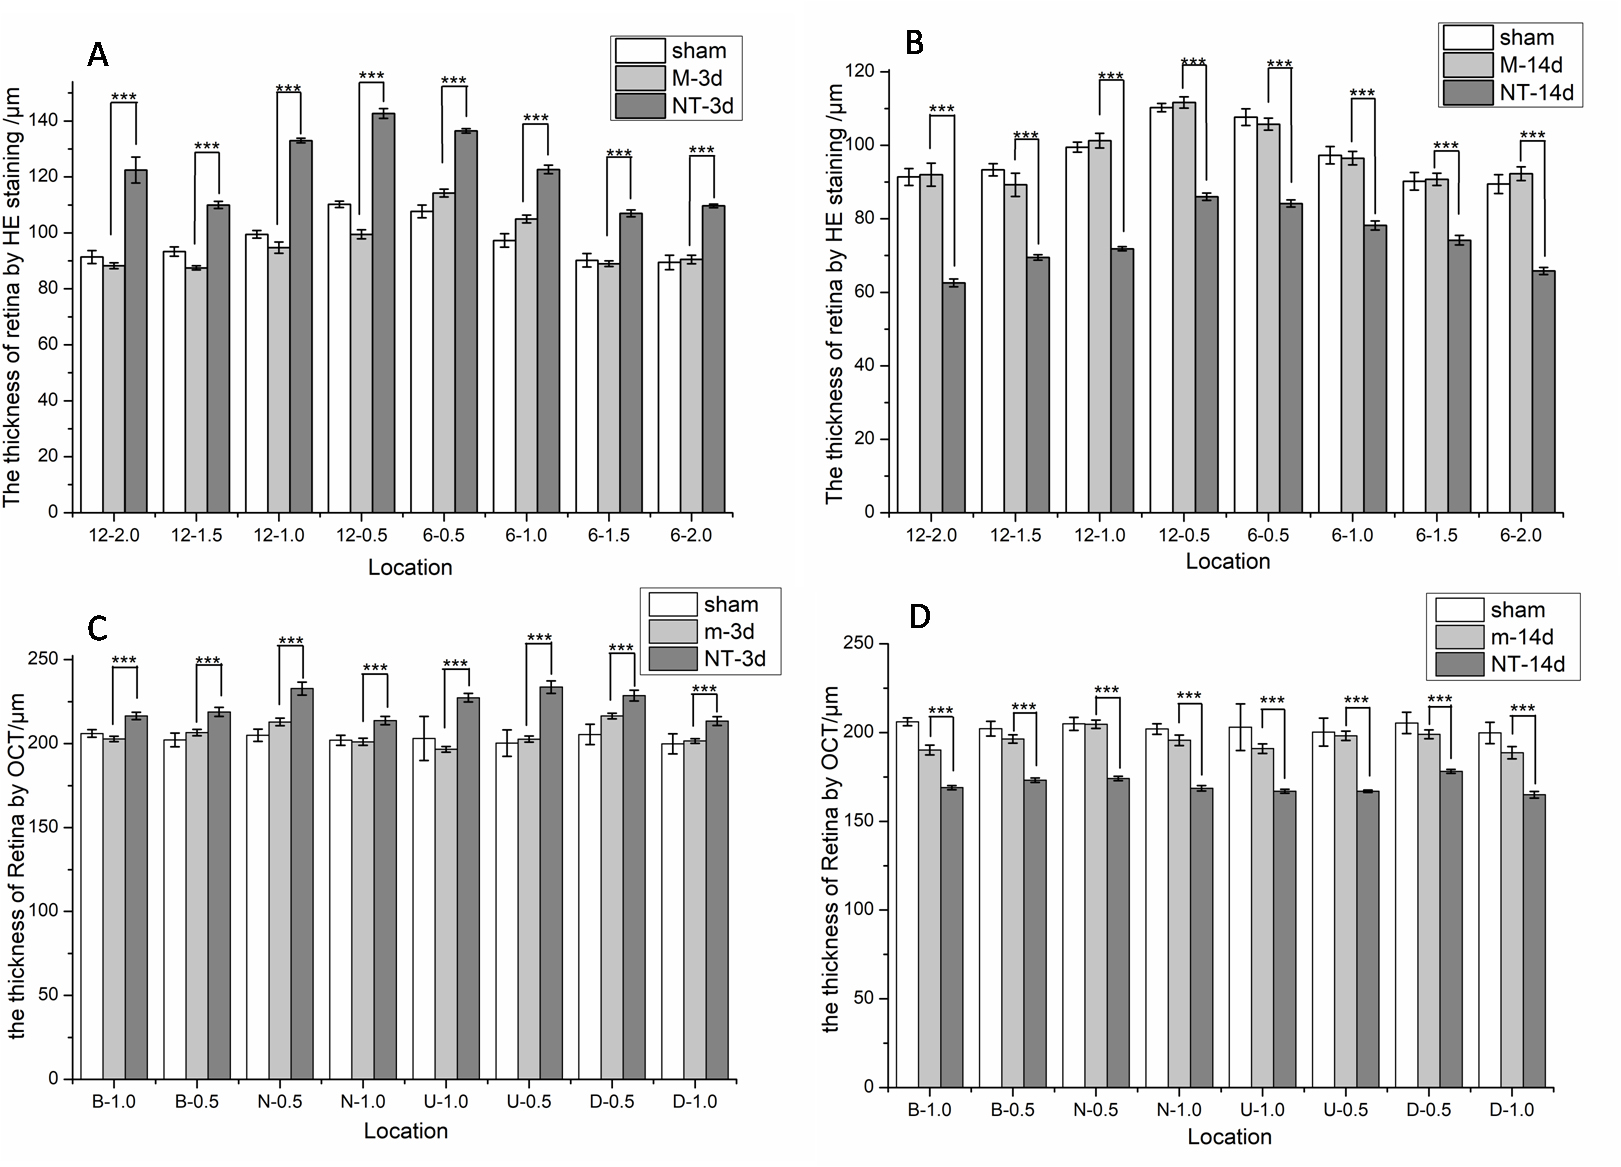
 Figure 5 of
Li, Mol Vis 2021; 27:438-456.
Figure 5 of
Li, Mol Vis 2021; 27:438-456.