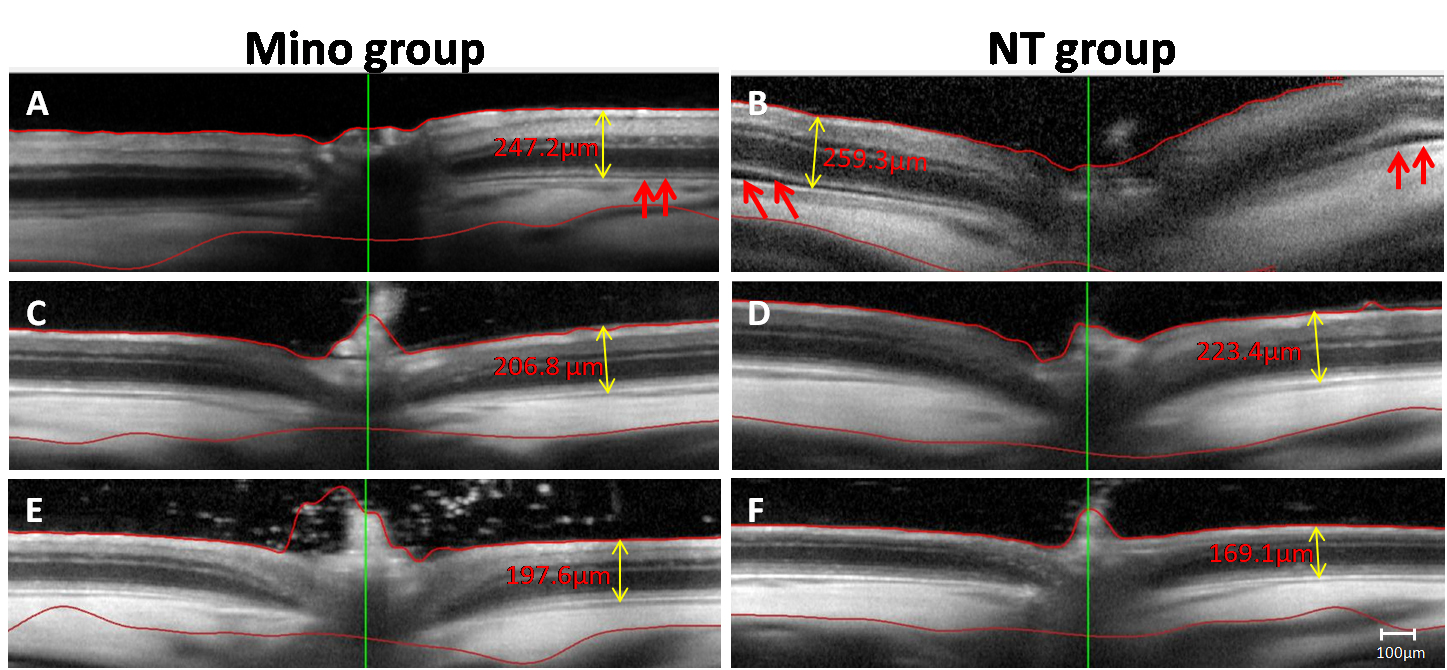
Figure 4. Representative optical coherence tomography (OCT) scans for the retinas of the minocycline group (A, C, E) and the non-minocycline treatment group (B, D, F) immediately after IR and at 3 days and 14 days after ischemia-reperfusion (IR). A, B: Retina edema and retinal detachment are observed immediately after IR as the red arrow points out in the minocycline treatment
(Mino) group and the no treatment (NT) group. C, D: At 3 days after IR, the retina of the NT group was thicker than that of the Mino group. E, F: At 14 days after IR, the retina of the NT group was thinner than that of the Mino group. n = 6. Scale bar: 100 μm.

 Figure 4 of
Li, Mol Vis 2021; 27:438-456.
  Figure 4 of
Li, Mol Vis 2021; 27:438-456.