Figure 11. Western blotting (left) and quantification (right) of GFAP, NRF2, IL-6, IBA-1, and HIF-1α protein expression profiles in the
neural retina 24 h after IR. ap<0.05 between the right eye of the no treatment (NT) group and the minocycline treatment (Mino) group; bp<0.05 between the left eye and the right eye of the minocycline (Mino) group. OS means left eye, and OD means right eye.
n = 6.
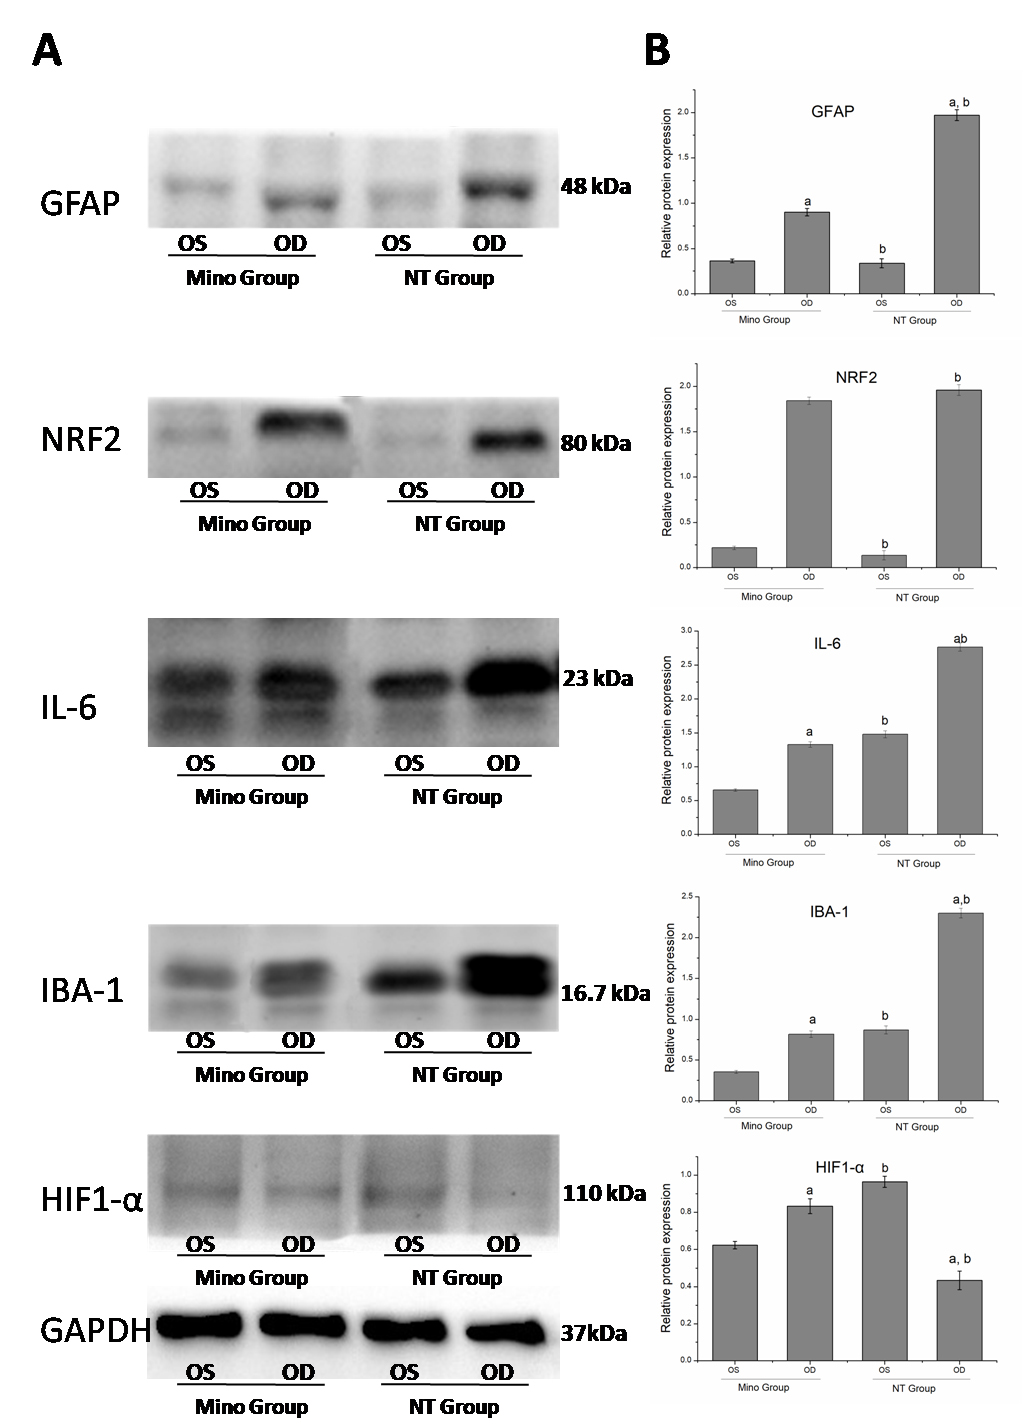
 Figure 11 of
Li, Mol Vis 2021; 27:438-456.
Figure 11 of
Li, Mol Vis 2021; 27:438-456.