Figure 10. Gene expression of iNOS, TNF-α, IL-1α, IL-6, Bcl-2, Bax, caspase-3, GFAP, Iba-1, Hif-1α, and Nrf2 in the neural retina evaluated with real-time PCR 12 h and 24 h after IR. The black box represents the minocycline treatment
(Mino) group; the red box represents the no treatment (NT) group. The column value of each group was obtained from the ratio
of the experimental eye to the fellow eye. Results from statistical analysis *p<0.05; **p<0.01; **p<0.001; n = 6.
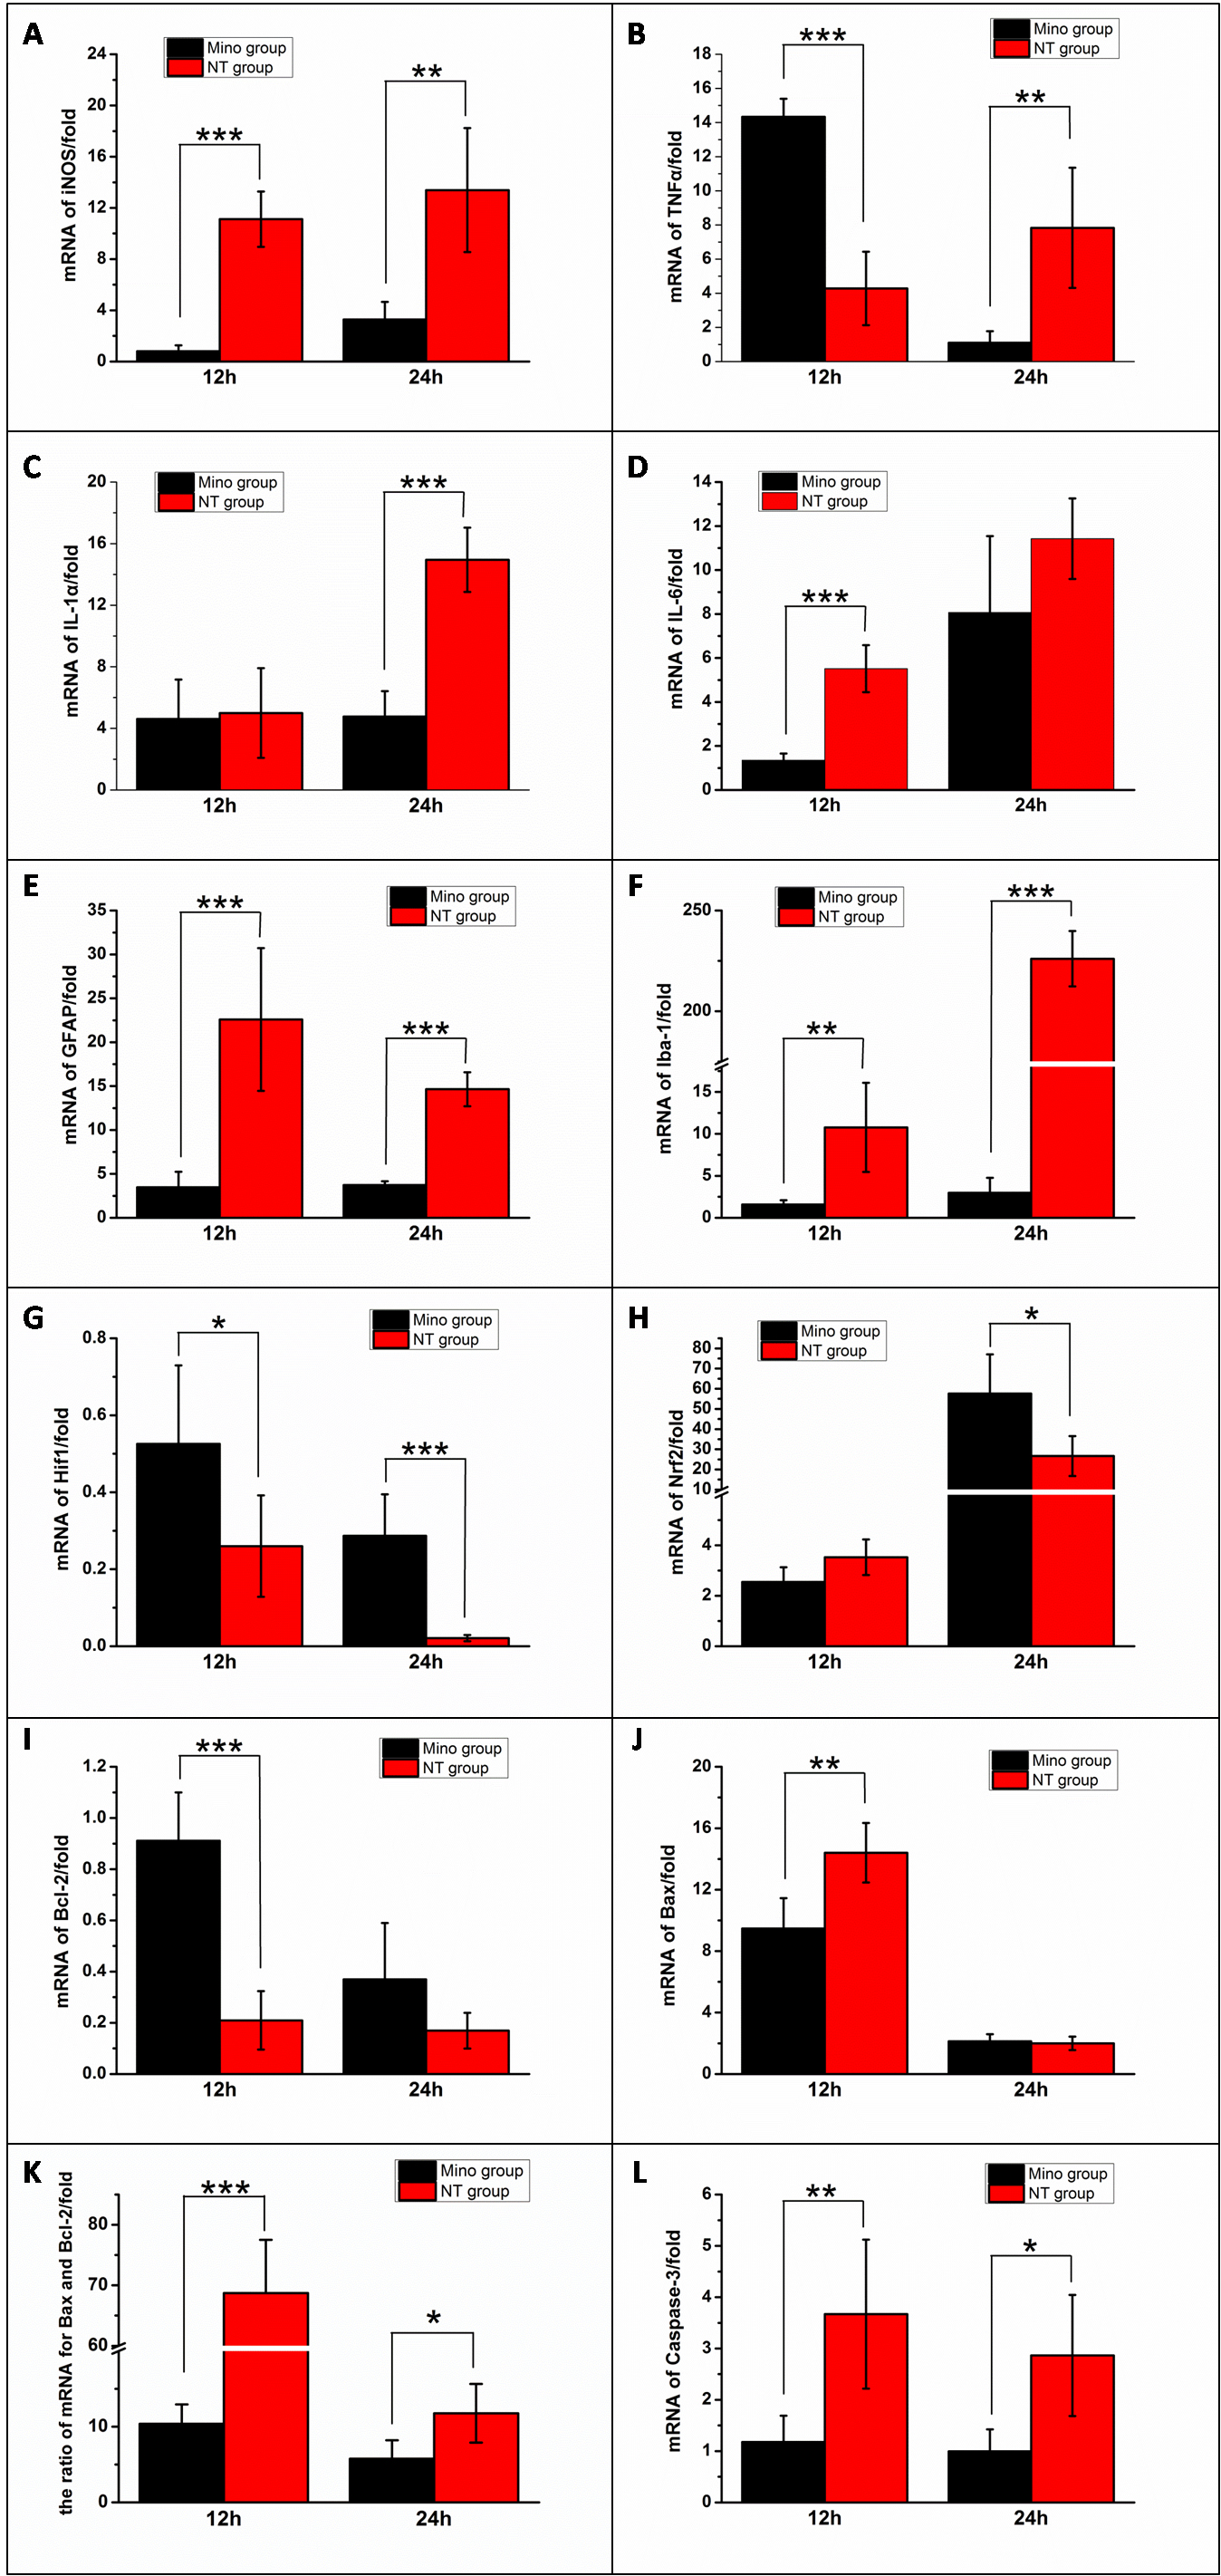
 Figure 10 of
Li, Mol Vis 2021; 27:438-456.
Figure 10 of
Li, Mol Vis 2021; 27:438-456.