Figure 1. The locations of the retinal thickness were measured and analyzed using coronal OCT. A: The corresponding fundus photography micrographic pictures of optical coherence tomography (OCT). B: OCT coronal images and the locations of retinal thickness analyzed at 0.5 mm and 1.0 mm intervals from the optic nerve.
Scale bar: 200 μm. N, nasal; T, temporal.
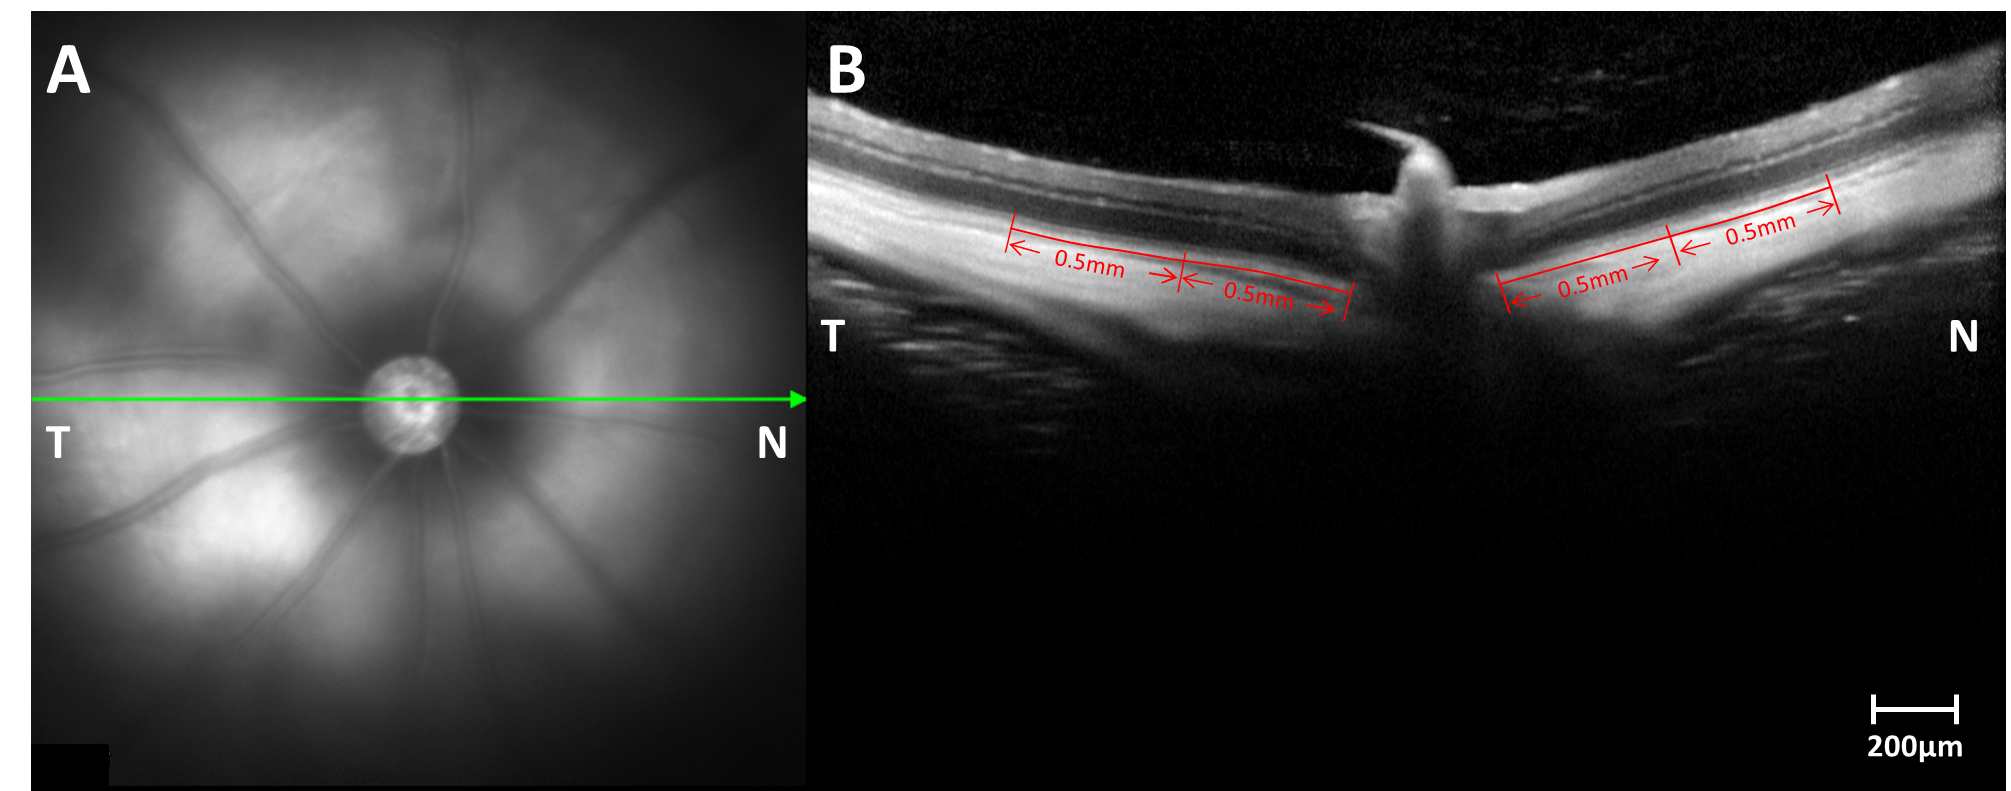
 Figure 1 of
Li, Mol Vis 2021; 27:438-456.
Figure 1 of
Li, Mol Vis 2021; 27:438-456.