Figure 1. Box and whisker plot showing median and interquartile range for distribution of serum prolactin levels [nanogram per milliliter
(ng/ml)] in the four groups [NoDR: no retinopathy (n=15), NPDR: non-proliferative diabetic retinopathy (n=16), PDR: proliferative
diabetic retinopathy (n=15) and controls (n=15)] showing decrease in serum prolactin levels with severity of diabetic retinopathy.
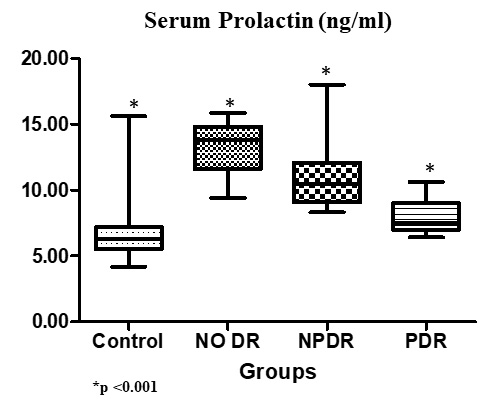
 Figure 1 of
Mohan, Mol Vis 2021; 27:429-437.
Figure 1 of
Mohan, Mol Vis 2021; 27:429-437.