Figure 5 of
Bawankar, Mol Vis 2021; 27:415-428.
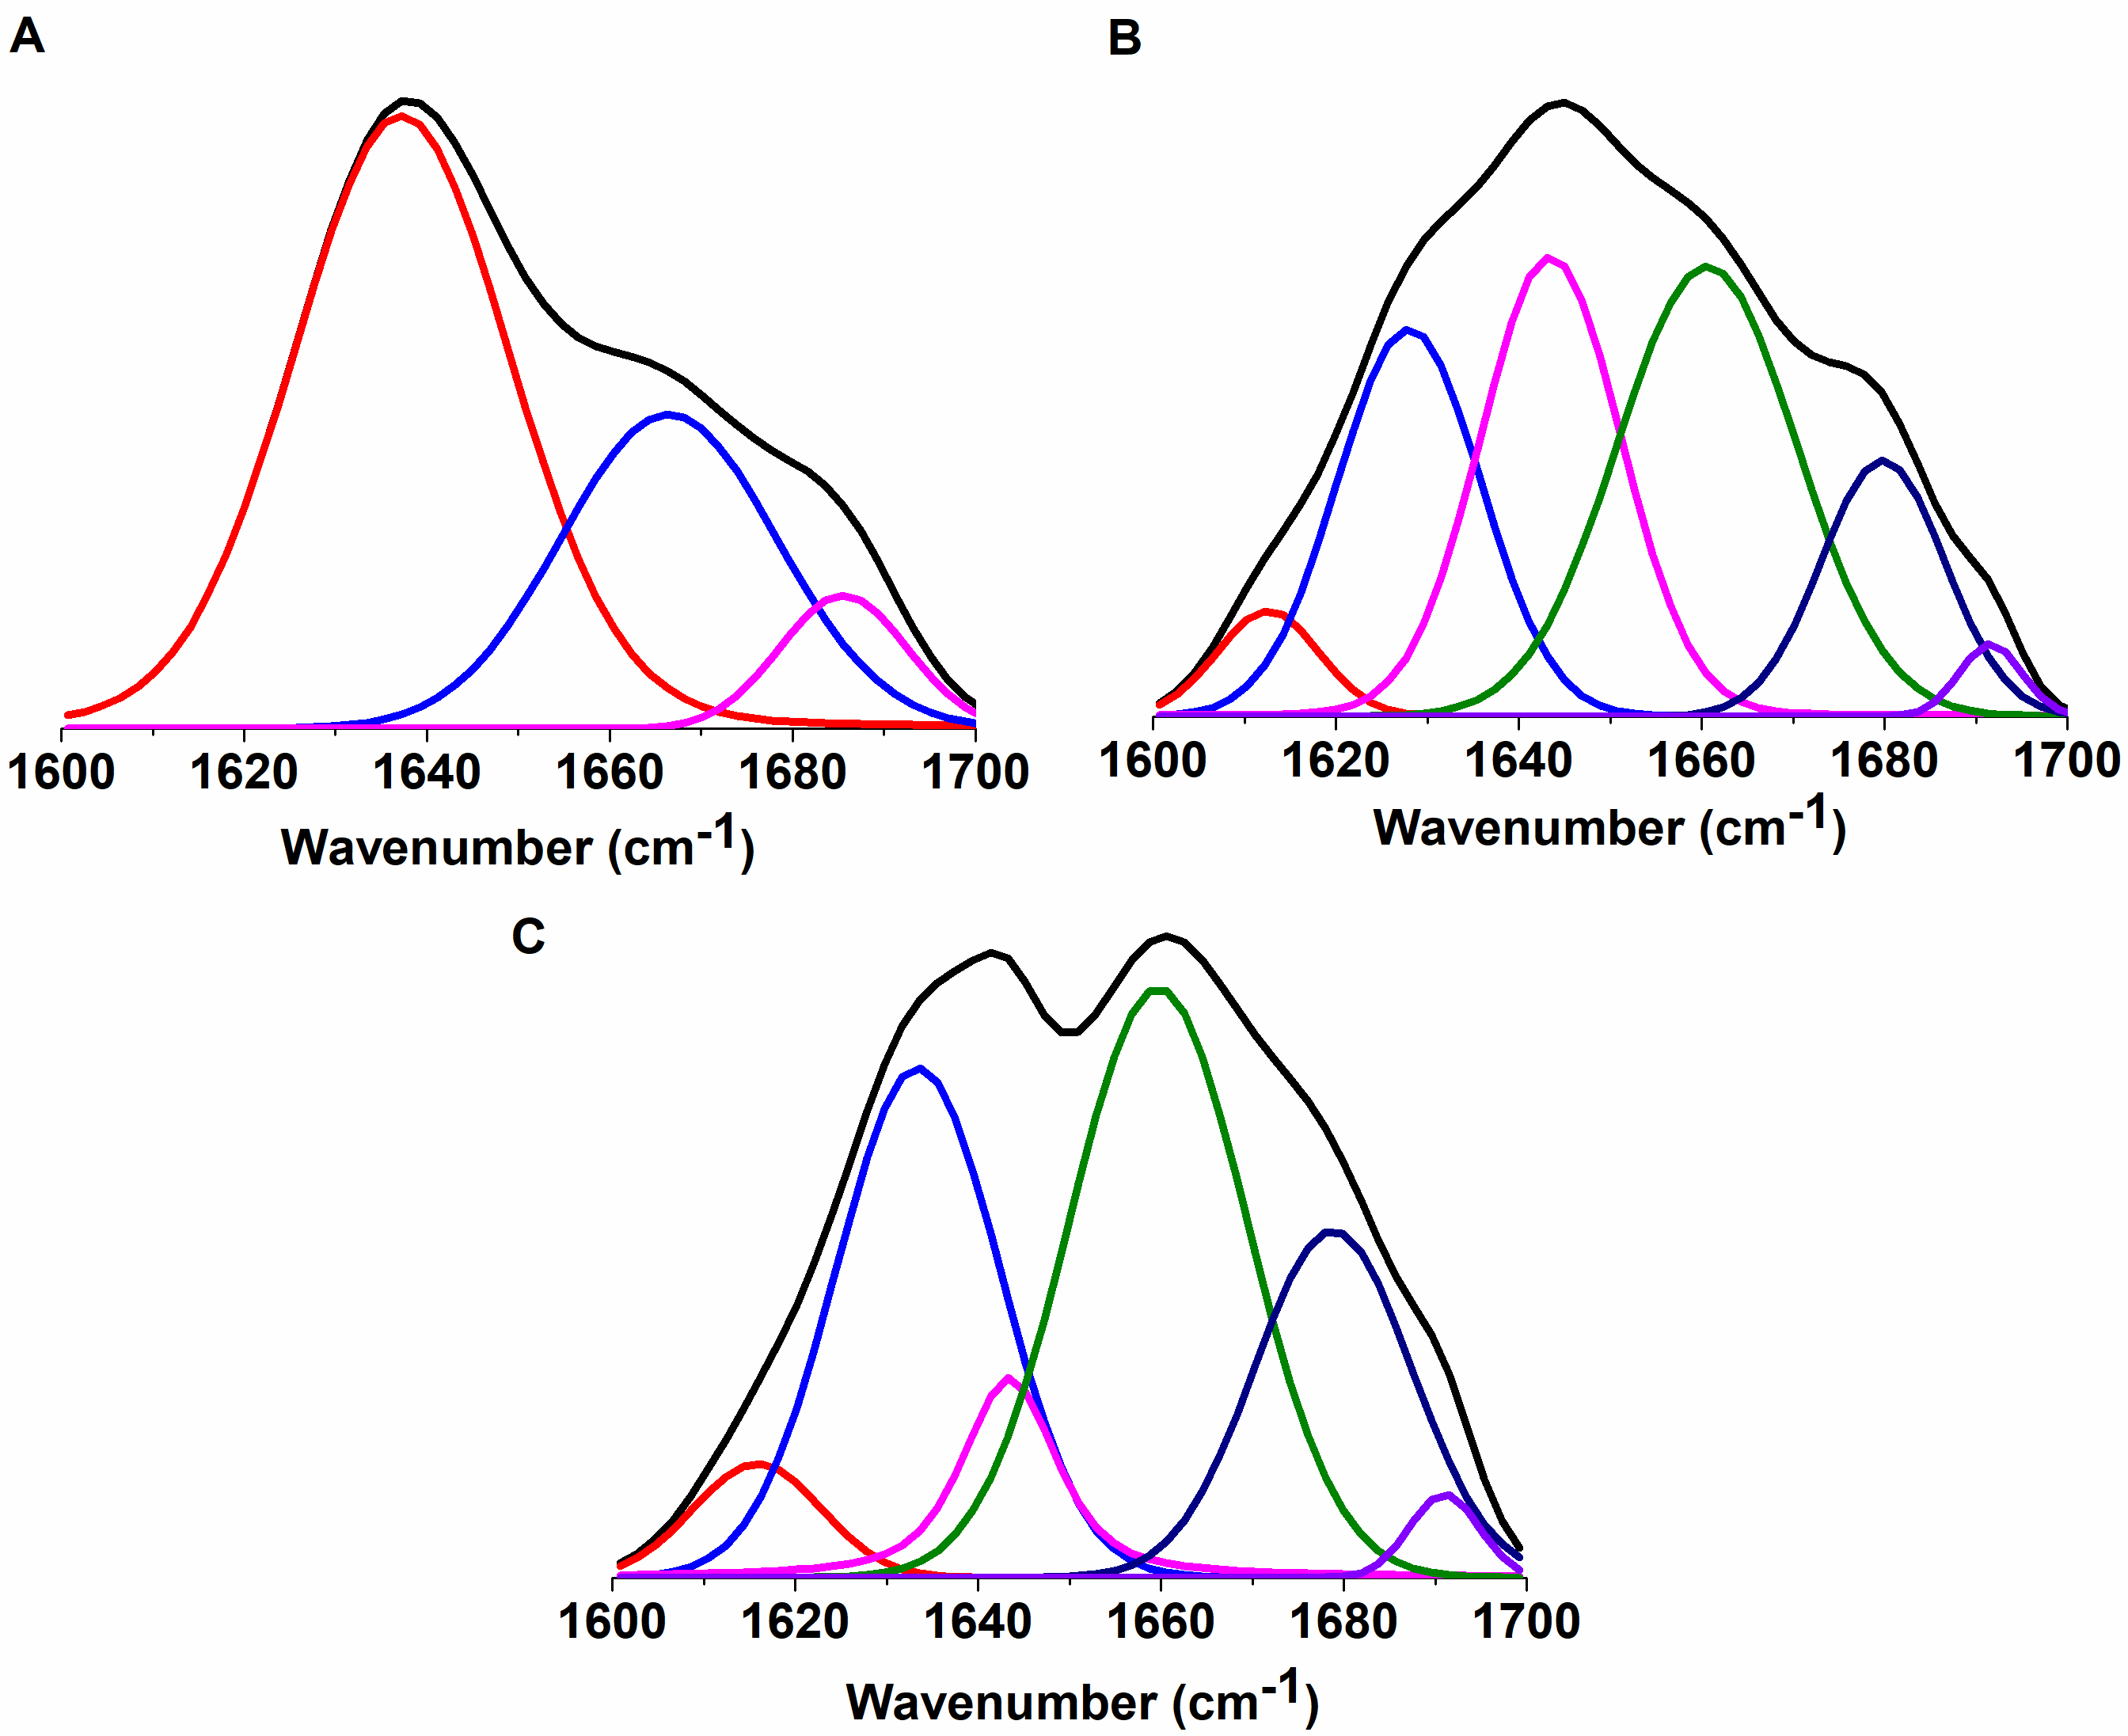
Figure 5.
Fourier transform infrared spectroscopy (FTIR) of monomers, oligomers, and fibrils. Curve fit spectra of (
A
) monomers, (
B
) oligomers, and (
C
) fibrils. n = 3 (n represents number of times an experiment was repeated).
 Figure 5 of
Bawankar, Mol Vis 2021; 27:415-428.
Figure 5 of
Bawankar, Mol Vis 2021; 27:415-428.