Figure 3. AFM images taken at different time points of the ongoing aggregation reaction of γD-crystallin in UV-C light. The upper panel
shows a two-dimensional (2D) image of the samples collected from the ongoing aggregation reaction. The lower panel represents
a three-dimensional (3D) view of the samples at the corresponding time point. The height of the samples is represented by
the color bar present on the right side of the upper panel. Atomic force microscopy (AFM) images represent monomers, oligomers,
and beaded fibrils. Scale bar = 1 µm.
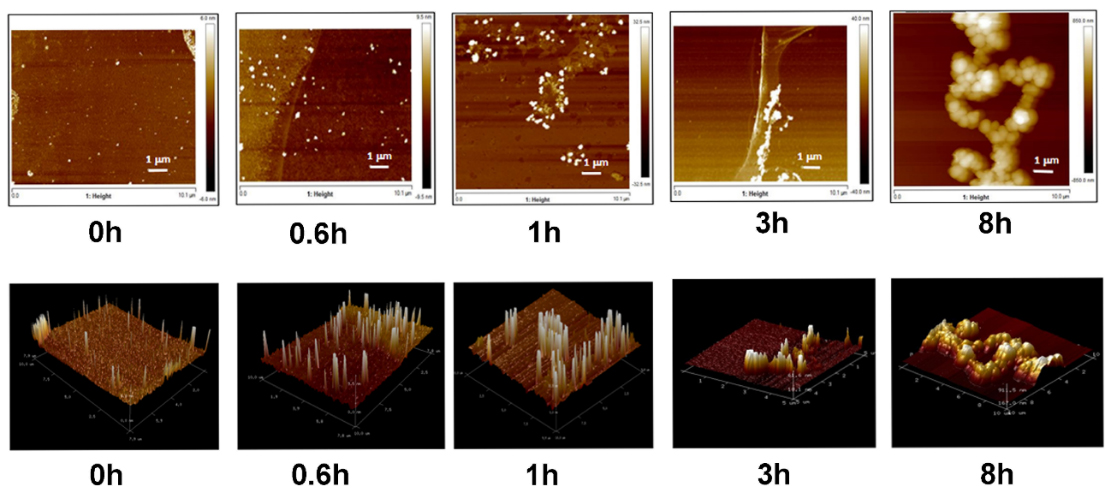
 Figure 3 of
Bawankar, Mol Vis 2021; 27:415-428.
Figure 3 of
Bawankar, Mol Vis 2021; 27:415-428.