Figure 3. MG132 recovered M3-EPHA2 to a greater level than WT did. After treatment with MG132 or CQ, the levels of M3 and WT EPHA2 were
analyzed by western blotting. The data depict the semiquantitative analysis based on the western blots, which are the averages
from three independent experiments. The relative band intensity was calculated in two steps. First, the values corresponding
to the intensity of the FLAG band were divided by those corresponding to the intensity of the β-actin band, and second, the
value in the treatment group (+) was divided by the value in the untreated group (−). The western blot images from the three
experiments are provided in Appendix 10. Endogenous control: β-actin, sample control: untreated group, n = 3, *p<0.05. ns:
not significant.
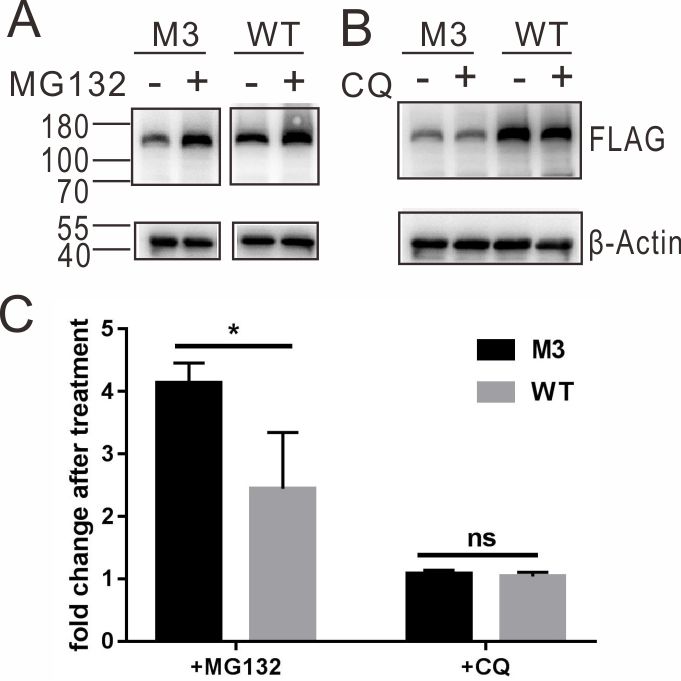
 Figure 3 of
Li, Mol Vis 2021; 27:403-414.
Figure 3 of
Li, Mol Vis 2021; 27:403-414.