Figure 2. M3 reduces EPHA2 levels. A: Western blot using anti-FLAG antibody. VEC: vector only. B: Semiquantitative analysis based on the western blot. The relative band intensity was calculated in two steps. First, the
values corresponding to the intensity of the FLAG band were divided by those corresponding to the intensity of the β-actin
band, and second, these values were divided by the values obtained for the WT. For the WT, this value was set to 1. The data
are the average from three independent experiments; the western blot images are provided in Appendix 9. Endogenous control:
β-actin, sample control: WT, n = 3, ****p<0.0001. C: Immunofluorescence of WT-EPHA2 and M3-EPHA2, red: FLAG, blue: nuclear, scale bar: 50 µm.
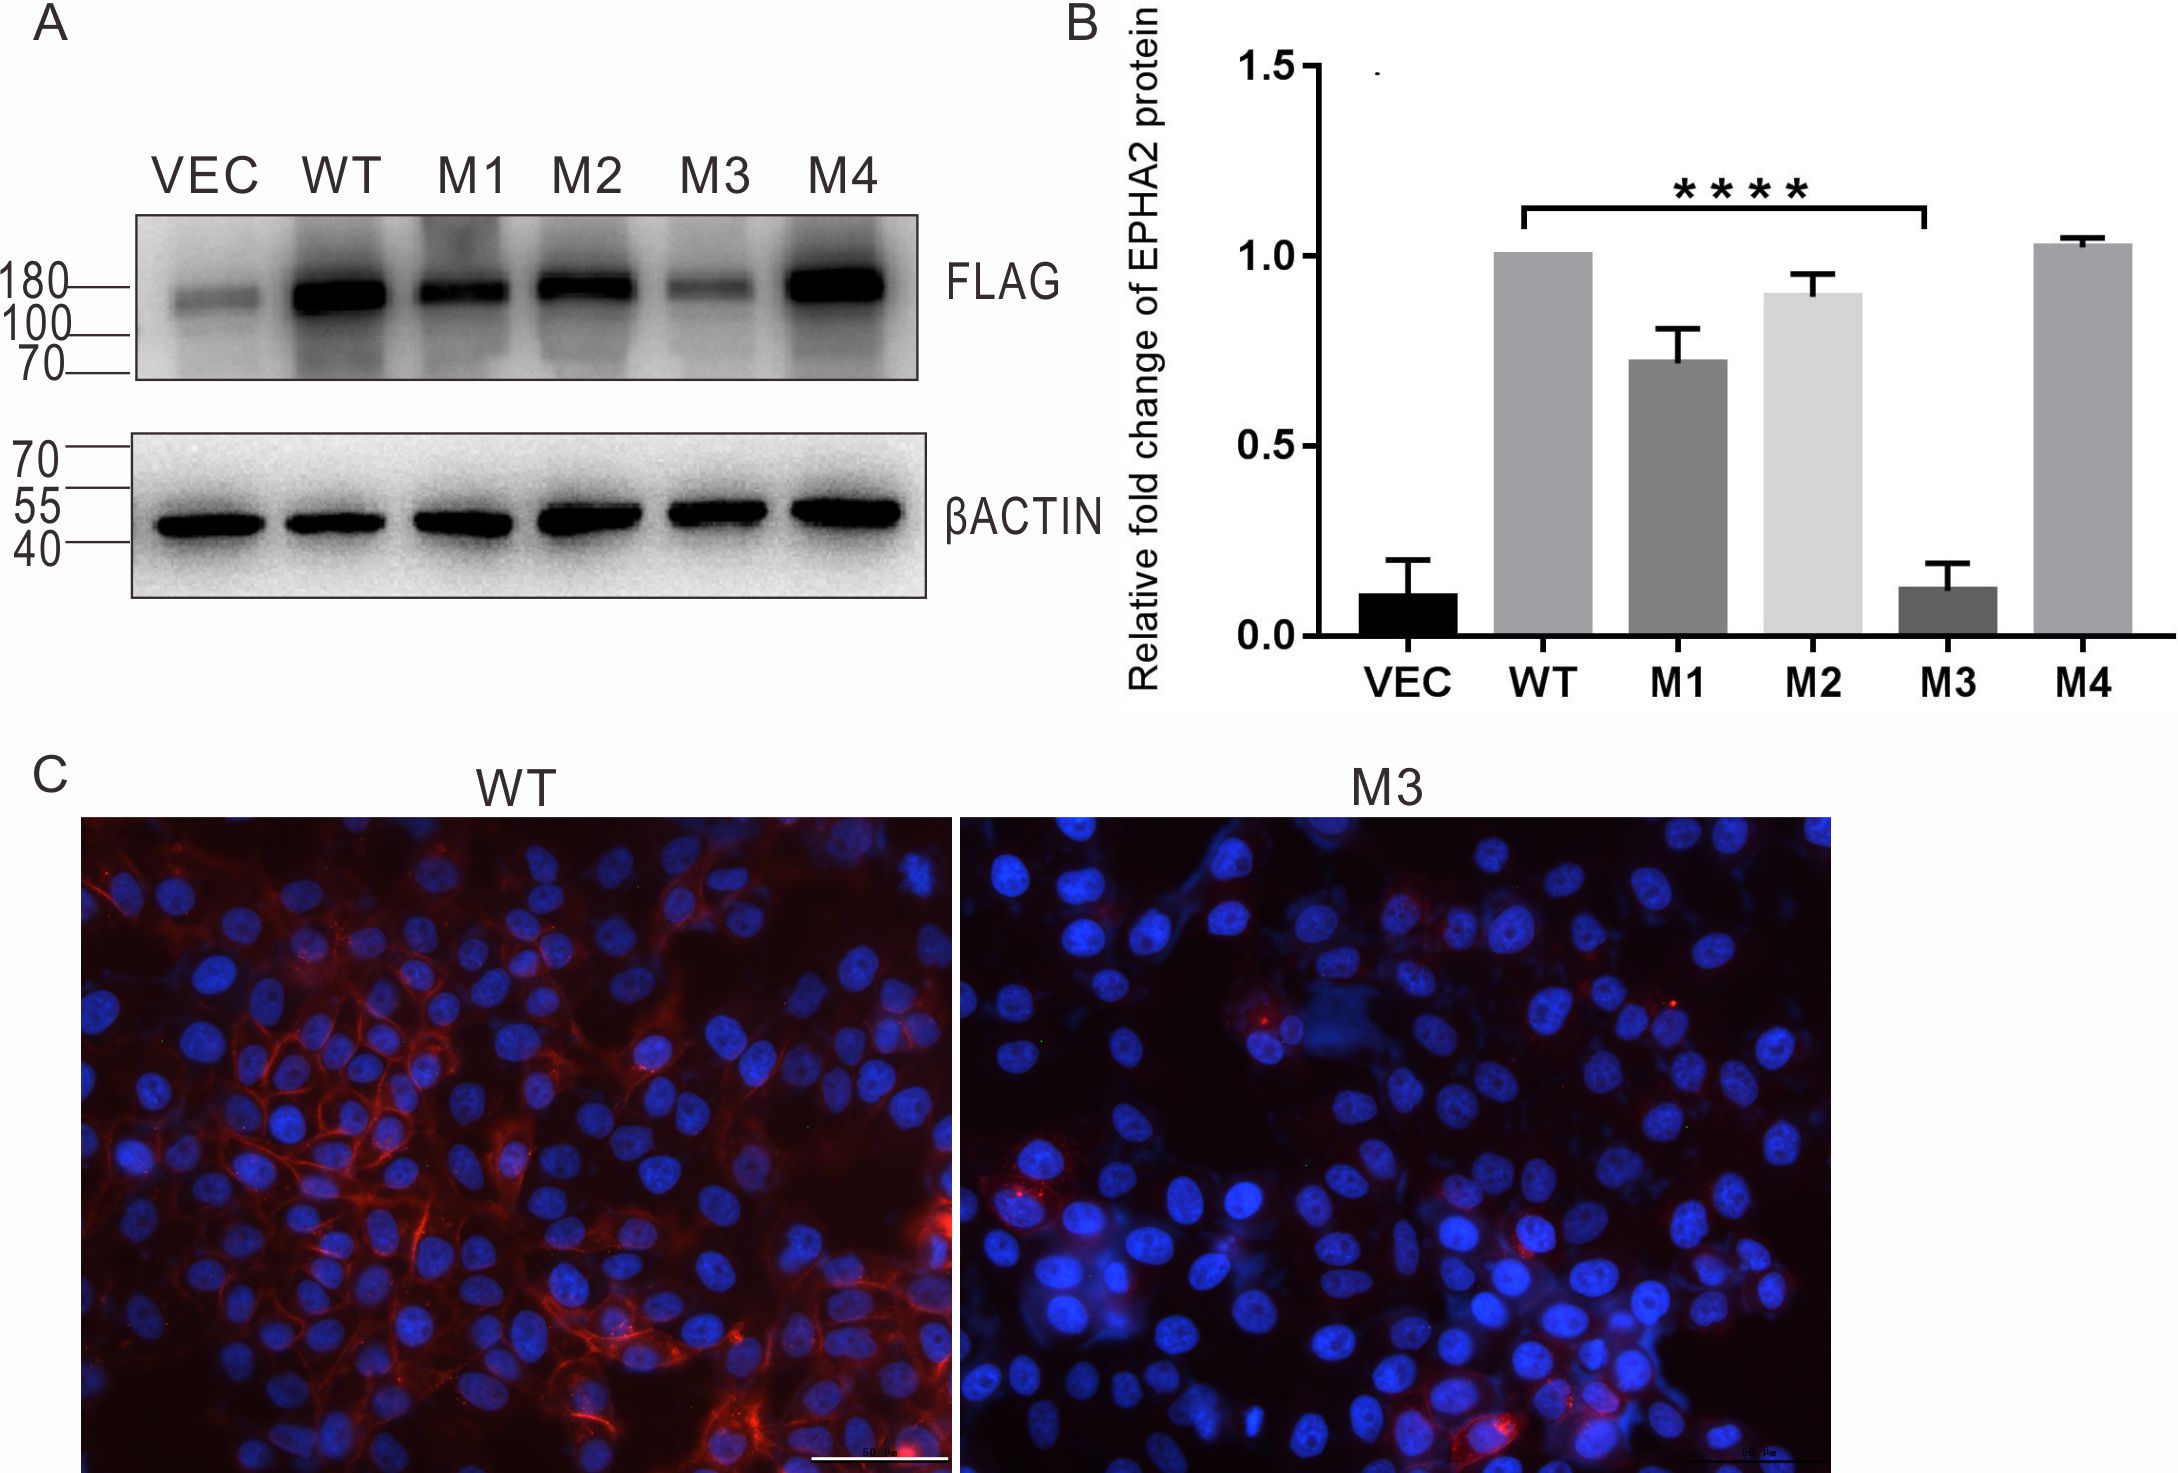
 Figure 2 of
Li, Mol Vis 2021; 27:403-414.
Figure 2 of
Li, Mol Vis 2021; 27:403-414.