Figure 3. Siblings 1, 2, 3, and control. A, B, C: Pattern electroretinograms of the right eyes of siblings 1, 2, and 3 show a decreased P50 amplitude (and a decreased downstream
N95 amplitude), indicative of macular photoreceptor dysfunction. The left eyes were similar. D: The right eye of a control subject.
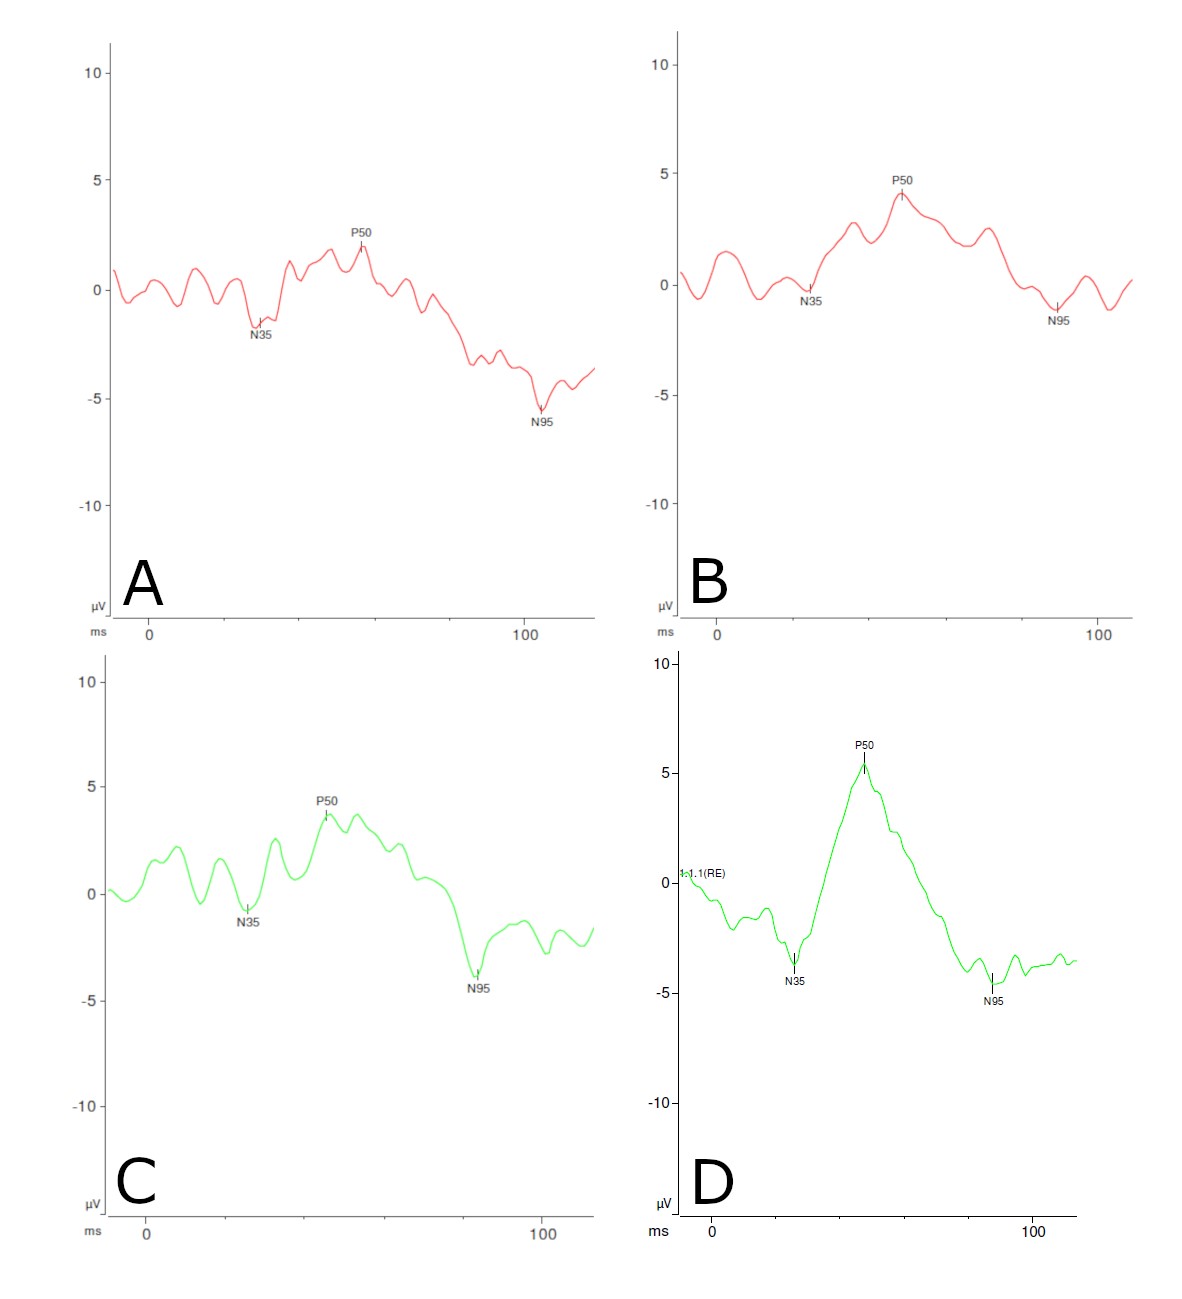
 Figure 3 of
Alsalamah, Mol Vis 2021; 27:396-402.
Figure 3 of
Alsalamah, Mol Vis 2021; 27:396-402.