Figure 5. Intraocular pressure profiles in rats treated with SA-2, Travoprost and SA2 NPs eye drops. Effect of single dose topically
administered SA-2 (75 mM) and SA-2 NPs (1%, 2.5 mM of SA-2) eye drop formulated in PBS in normotensive (A–C, n = 3, Sprague Dawley) and the Morrison intraocular pressure (IOP) elevation model (D, n = 3,, Brown Norway) rats at 3, 6, 24, 48, and 72 h post dose. Travoprost (0.004%) was used as positive control. *p<0.001
and #p<0.05 (rank-sum test), n = 3 rats per group. Contralateral eyes were used as controls. Values are expressed in mean
± standard error of the mean (SEM).
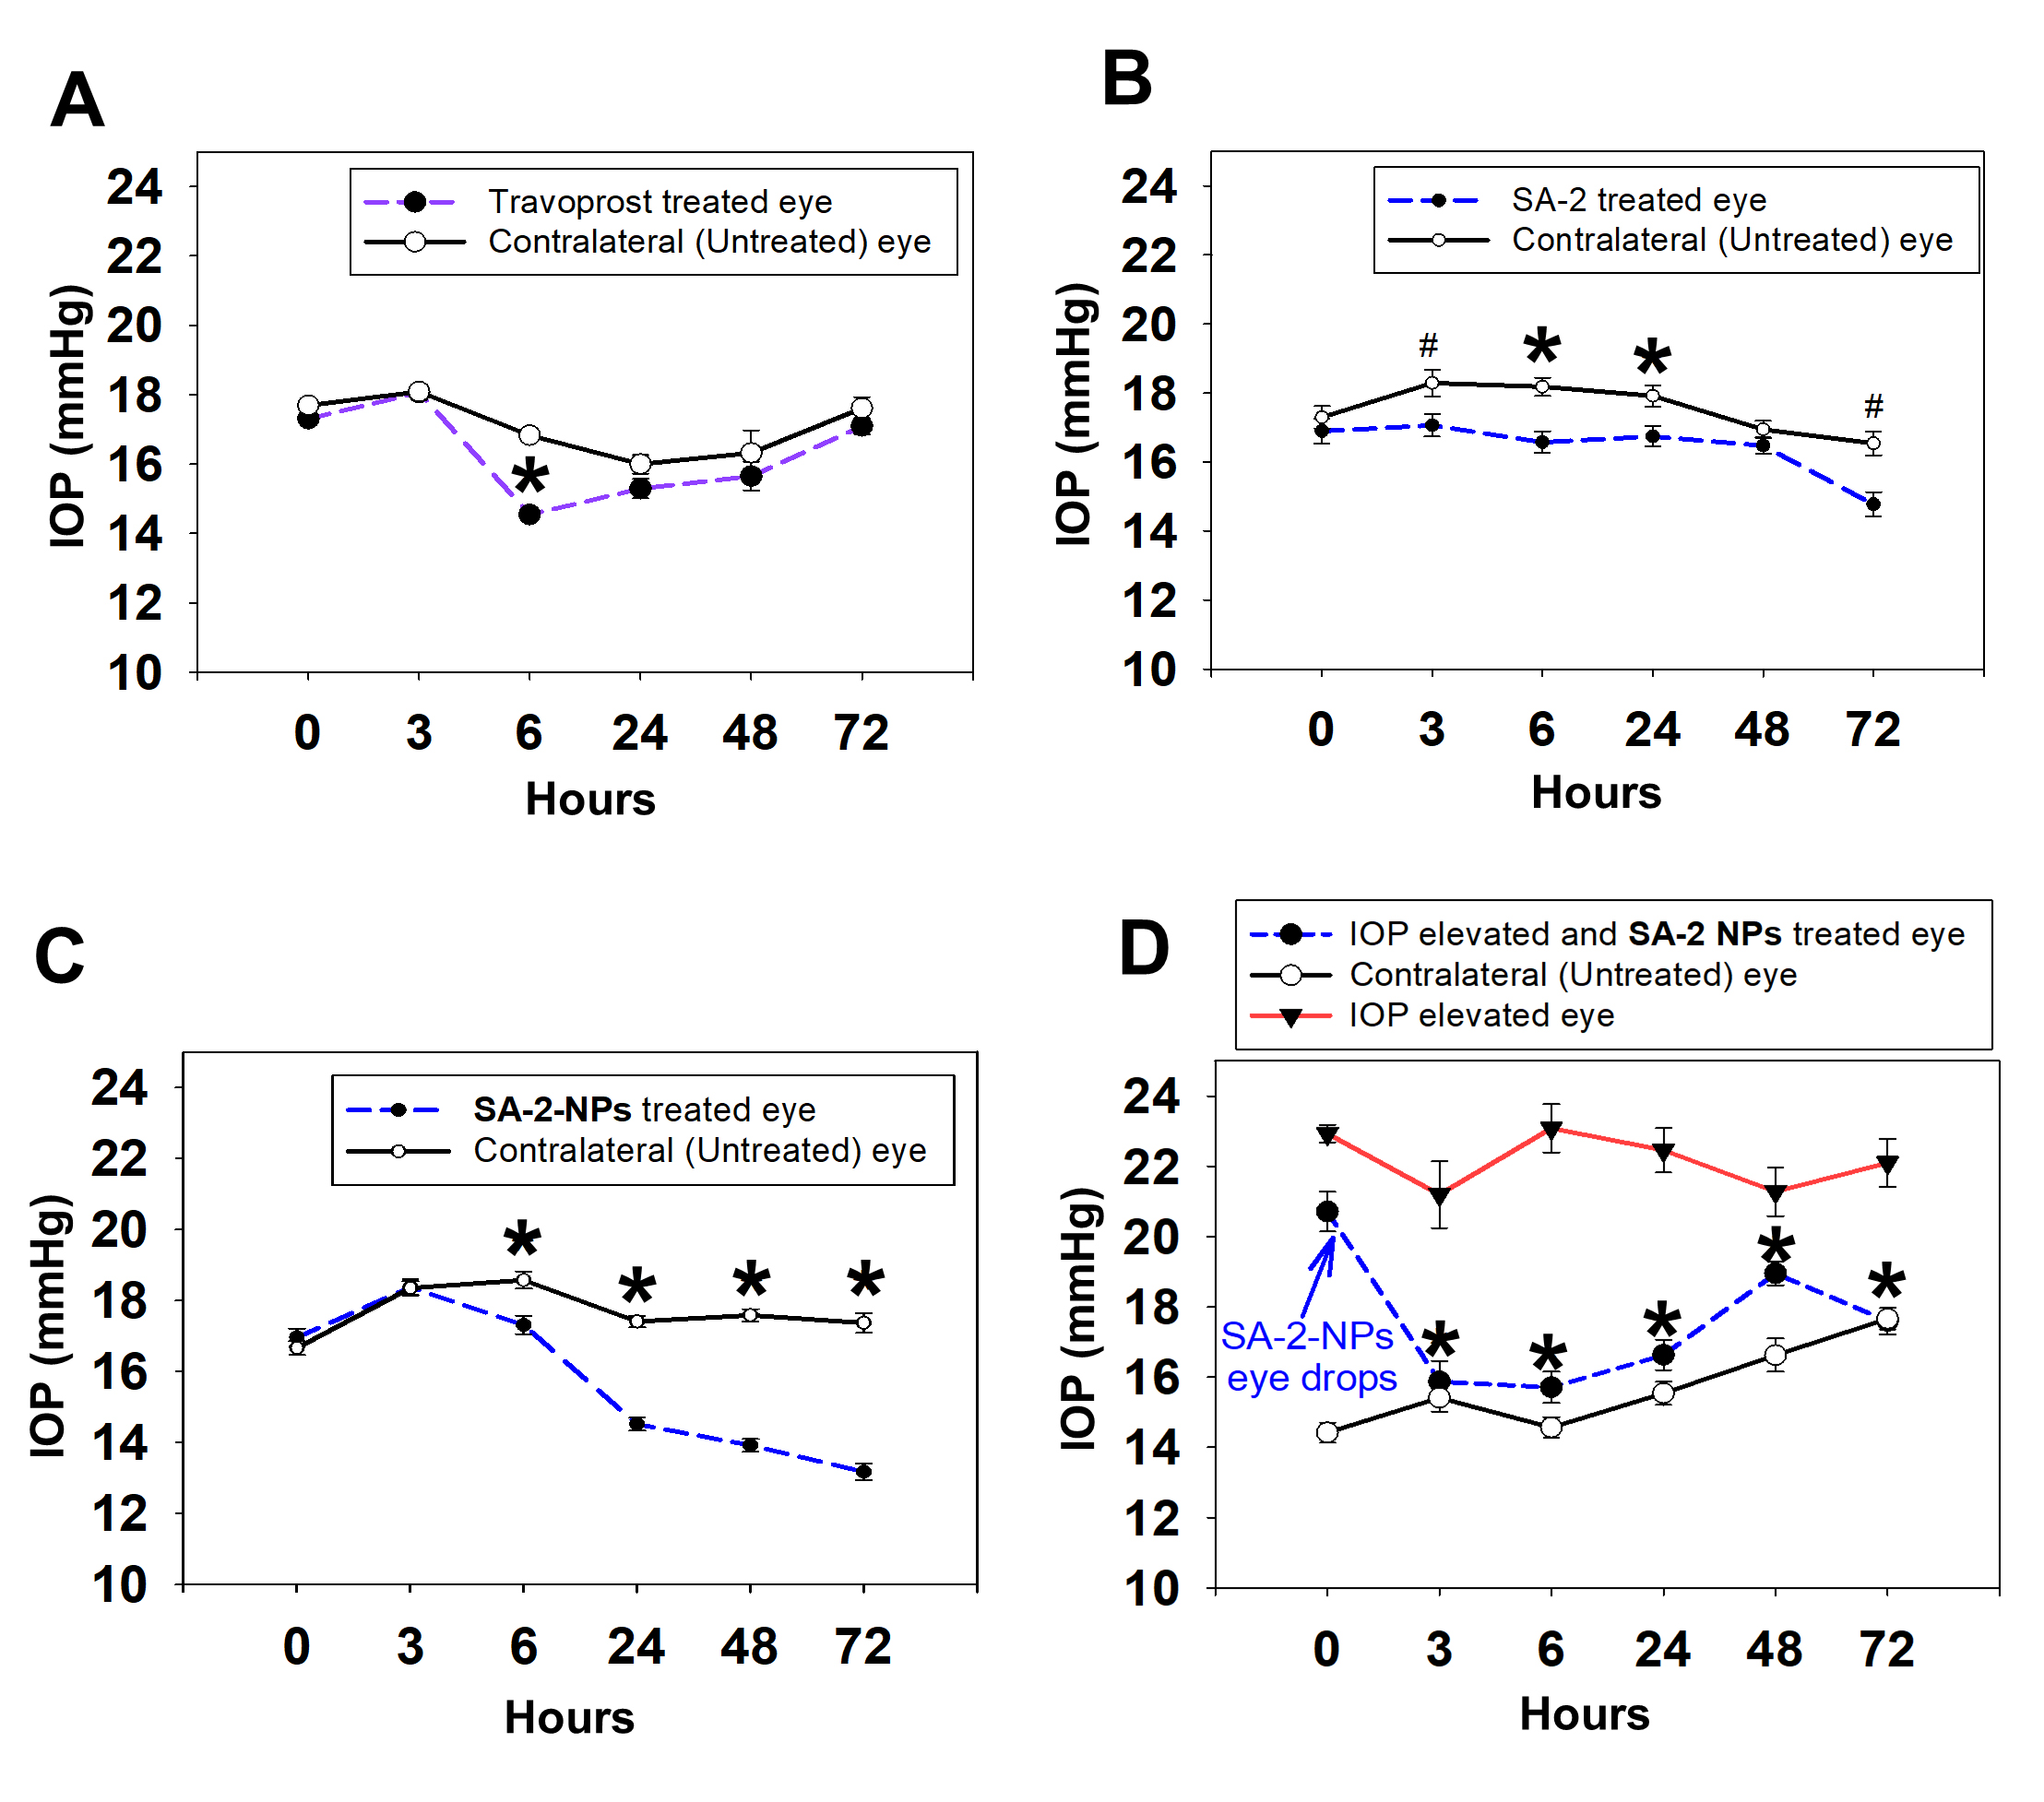
 Figure 5 of
Stankowska, Mol Vis 2021; 27:37-49.
Figure 5 of
Stankowska, Mol Vis 2021; 27:37-49.