Figure 2. Changes in neuronal measurements after I/R and administration of forskolin eye drops. A: Sections from control, ischemia/reperfusion (I/R), control+forskolin eye drops, and I/R+forskolin eye drops were processed
for measurement of cell numbers in the ganglion cell layer (B) and retinal thickness (C). Panel A shows representative images for each group. Scale bar: 50 μm. *p<0.05 versus control, #p<0.05 versus I/R. Data are mean ±
standard error of the mean (SEM). n = 8 sections/mouse from five mice.
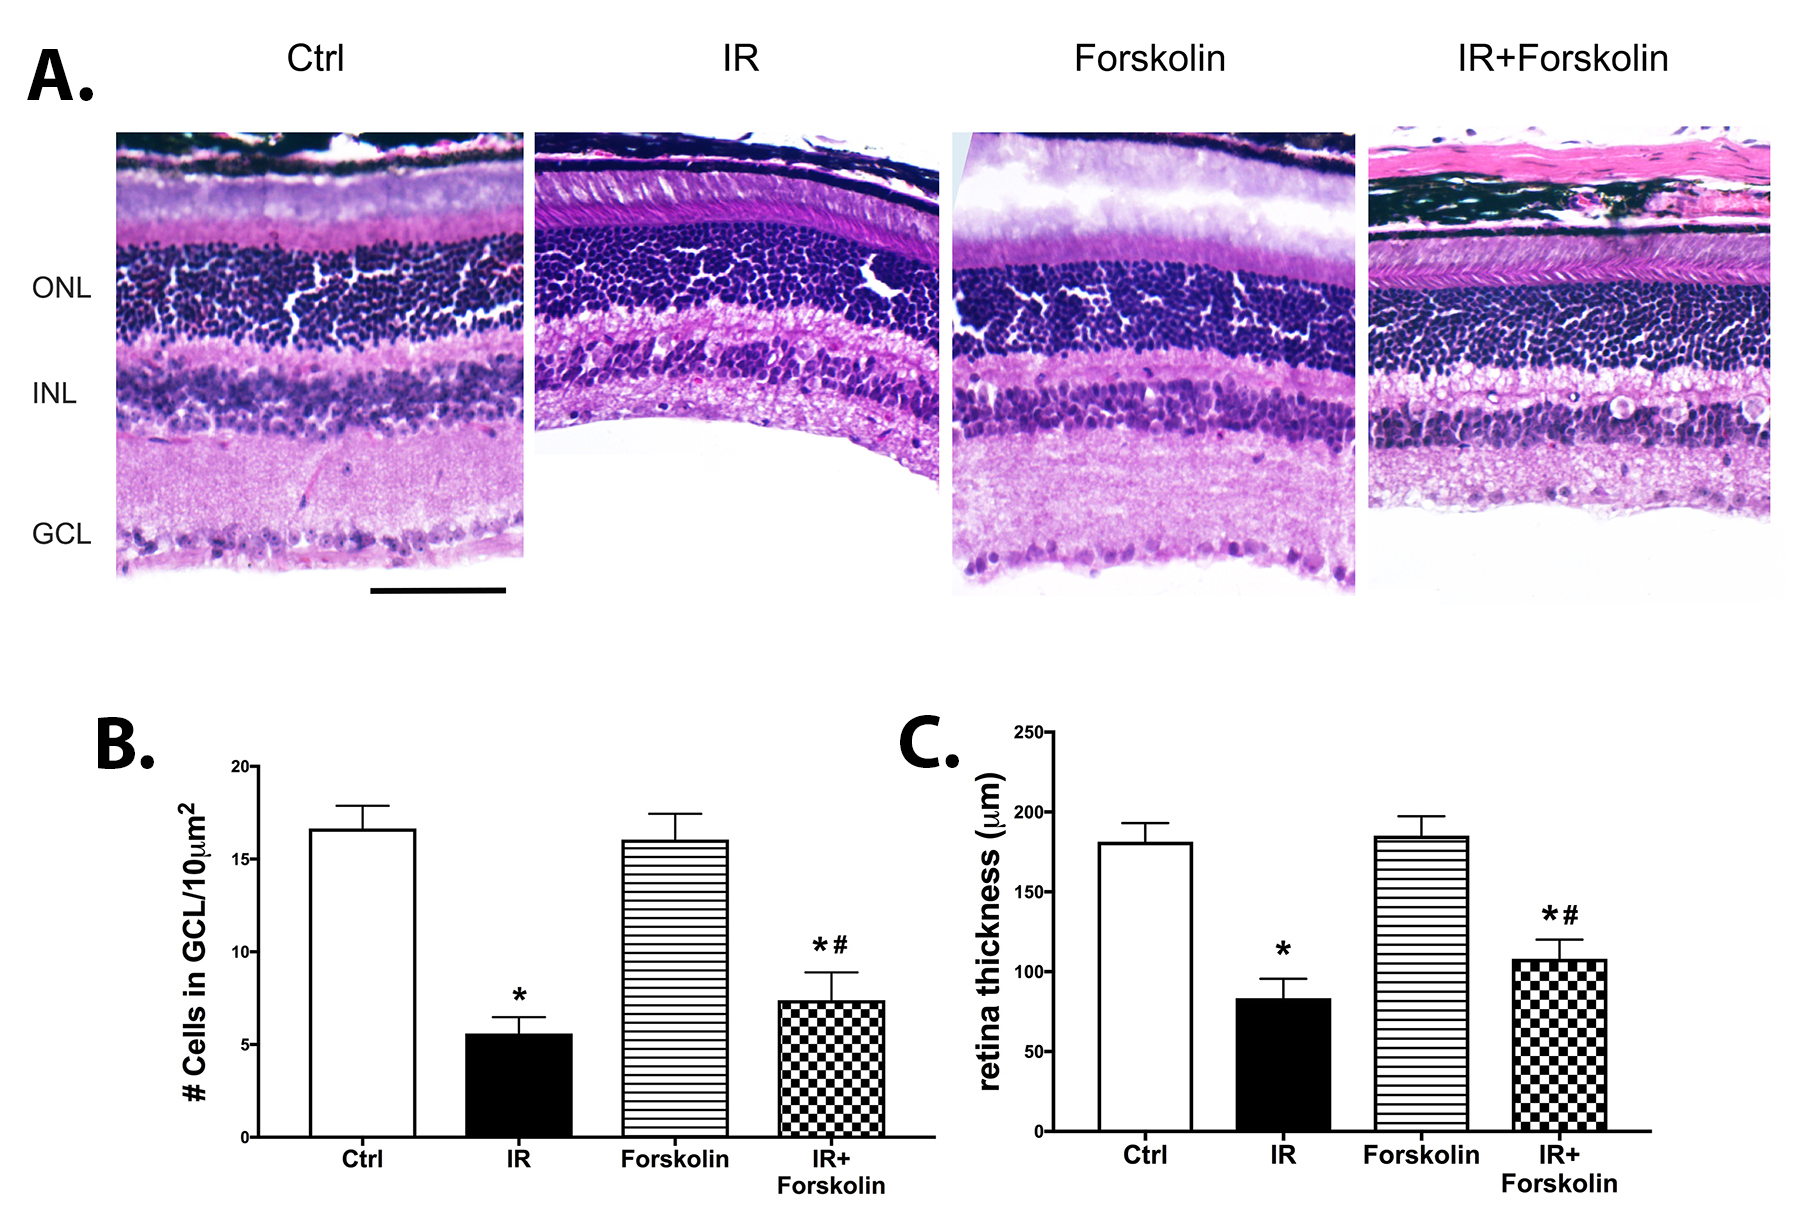
 Figure 2 of
Liu, Mol Vis 2021; 27:365-369.
Figure 2 of
Liu, Mol Vis 2021; 27:365-369.