Figure 2. Piezo2 expression in neural cells of human retina and optic nerve. A: An image of the human retina and optic nerve head with Piezo2 immunofluorescence (red) and 4′,6-diamidino-2-phenylindole
(DAPI) nuclei (blue) is presented. The retinal (B) and ONH (D) tissues in white frames are shown in high magnification. B: Piezo2 (red) was detected in the NFL, GCL, INL, and ONL. Colabeling analysis with Piezo2 (red) and SNCG (green) or GFAP
(green) antibodies indicates retinal ganglion cells (RGCs) and astrocytes could express Piezo2. C: Piezo2-positive cell fractions were 0.80, 0.54, 0.32, and 0.65 in the NFL, GCL, INL, and ONL (n = 3). Statistically significantly
higher expression of Piezo2 was observed in the ONL (p<0.0001, n = 3). ****p<0.0001 with one-way analysis of variance (ANOVA).
D: Co-IHC analysis with Piezo2 (red) and GFAP (green) antibodies indicated that astrocytes in the ONH express Piezo2. The nuclei
were stained with 4′,6-diamidino-2-phenylindole (DAPI) in blue. Scale bar: 50 µm. NFL: nerve fiber layer, GCL: ganglion cell
layer, INL: inner nuclear layer, ONL: outer nuclear layer, ONH: human optic nerve head, SNCG: synuclein gamma, GFAP: glial
fibrillary acidic protein.
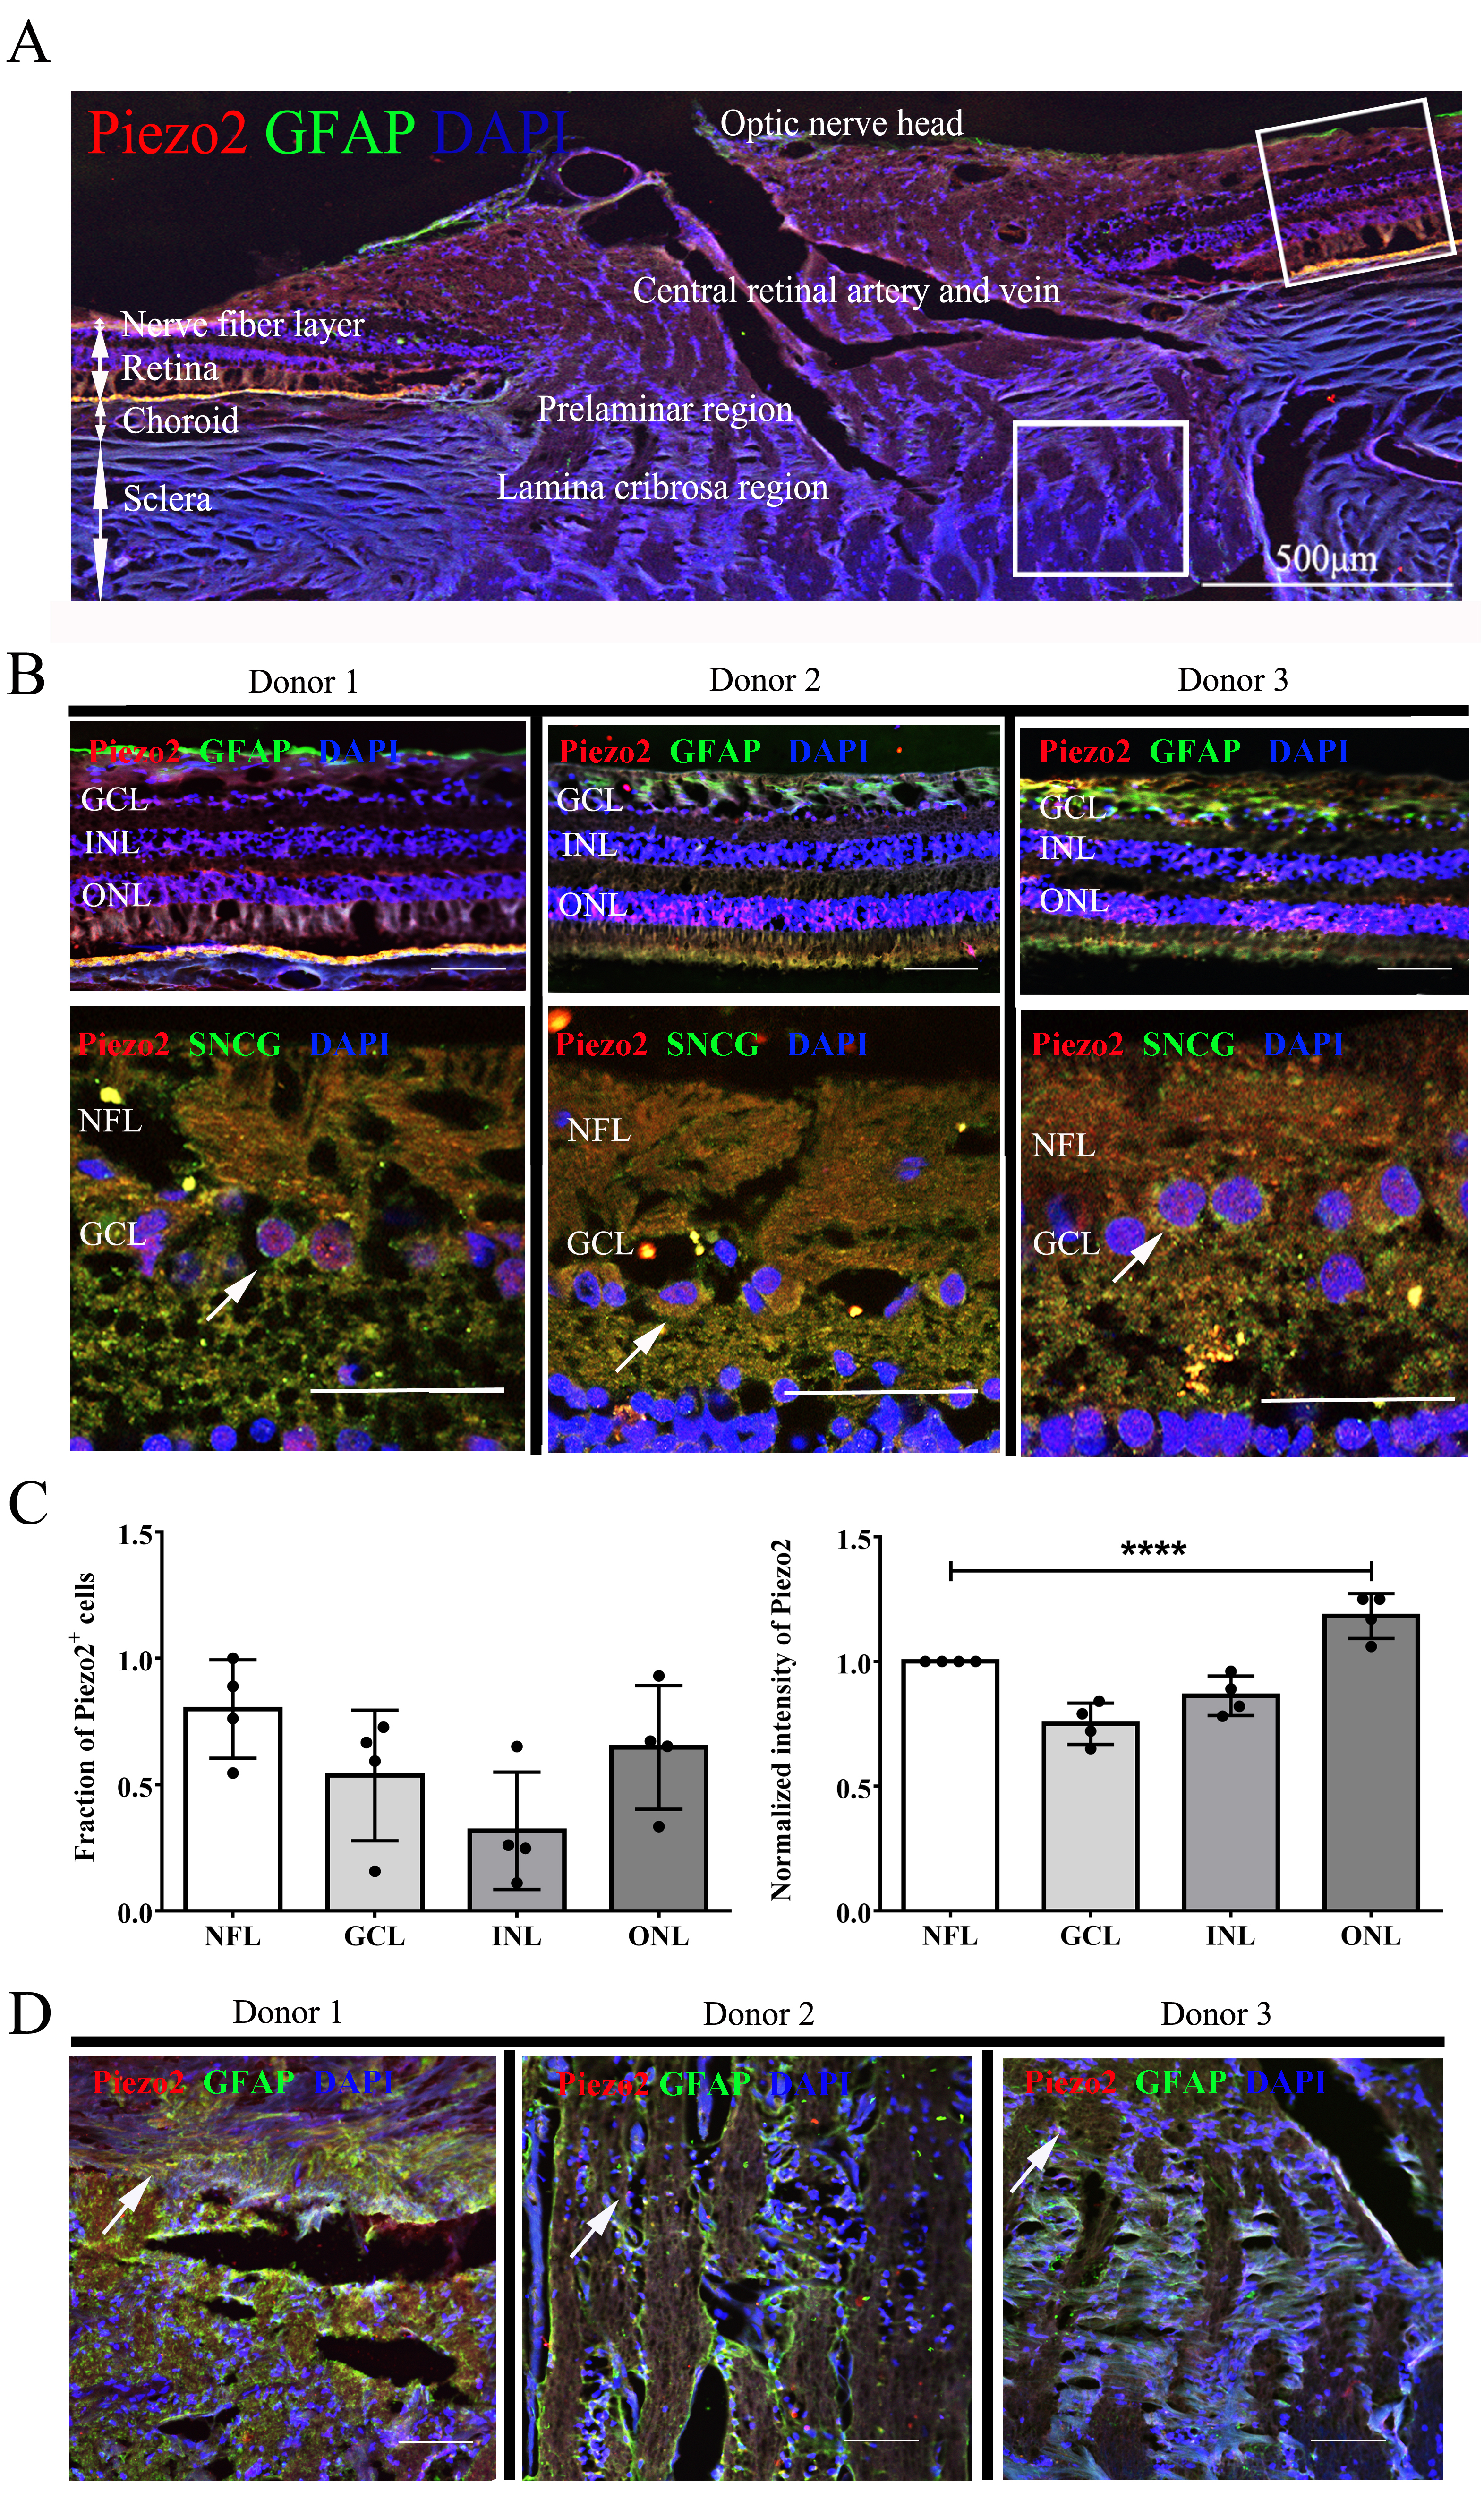
 Figure 2 of
Fang, Mol Vis 2020; 27:354-364.
Figure 2 of
Fang, Mol Vis 2020; 27:354-364.