Figure 4. Comparison of mean biomarker concentrations obtained with ELISA and with antibody microarrays in the DE and CT groups. A: Comparison of the concentrations of CST4, S100A6, and MMP9 biomarkers in control (CT; n = 14) and dry eye (DE; n = 32) groups
measured using the standard individual ELISA assays and customized multiplexed antibody microarrays. Concentration is expressed
in ng/ml. The bars represent a comparison of mean biomarker concentration in the DE group relative to the CT group. Error
bars show standard deviation, and * indicates statistical significance relative to control (p value <0.05). B: Regression analyses of the results obtained with ELISA and antibody microarray technology. In all three cases, the p values
associated with the linear regressions were lower than 0.001.
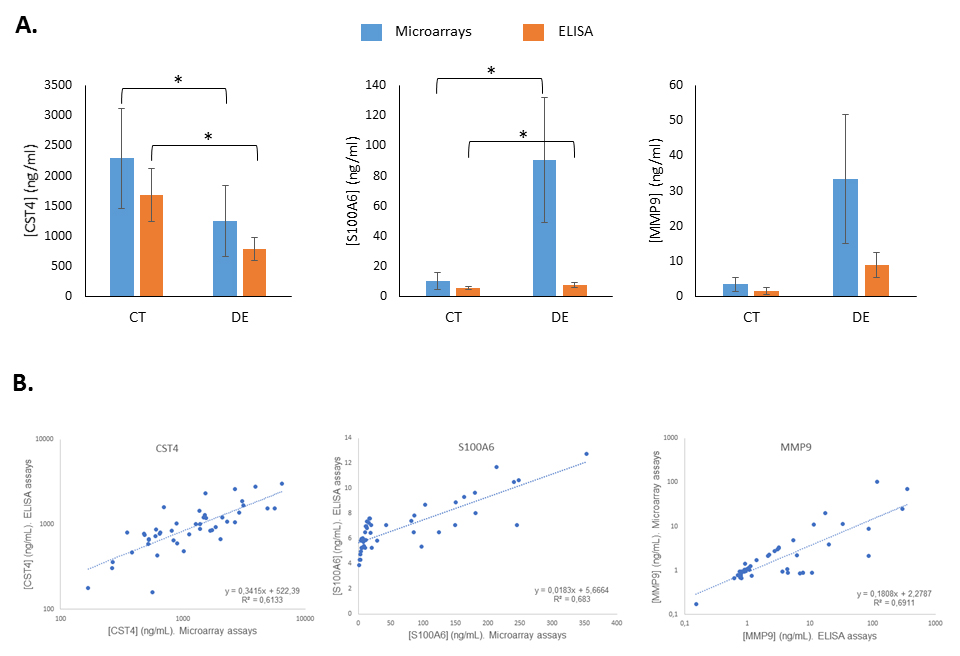
 Figure 4 of
Benitez-del-Castillo, Mol Vis 2021; 27:243-261.
Figure 4 of
Benitez-del-Castillo, Mol Vis 2021; 27:243-261.