Figure 3. Correlation of validated tear biomarkers with clinical endpoints. A: Hierarchical clustering of variables. The horizontal axis of the dendrogram represents the distance or dissimilarity between
clusters. B: Correlation matrix of biomarker concentrations and clinical parameters. The intense green and intense red represent significant
positive and negative correlations, respectively. Significant correlations are indicated in bold (p value <0.05). OSDI: ocular
surface disease index; SCH: Schirmer test; MH: meniscus height; OSM: osmolarity; FLUO: fluorescein staining; LG: lissamine
green; TBUT: tear breakup time; MGE: meibomian gland expression; MGQ: meibomian gland quality.
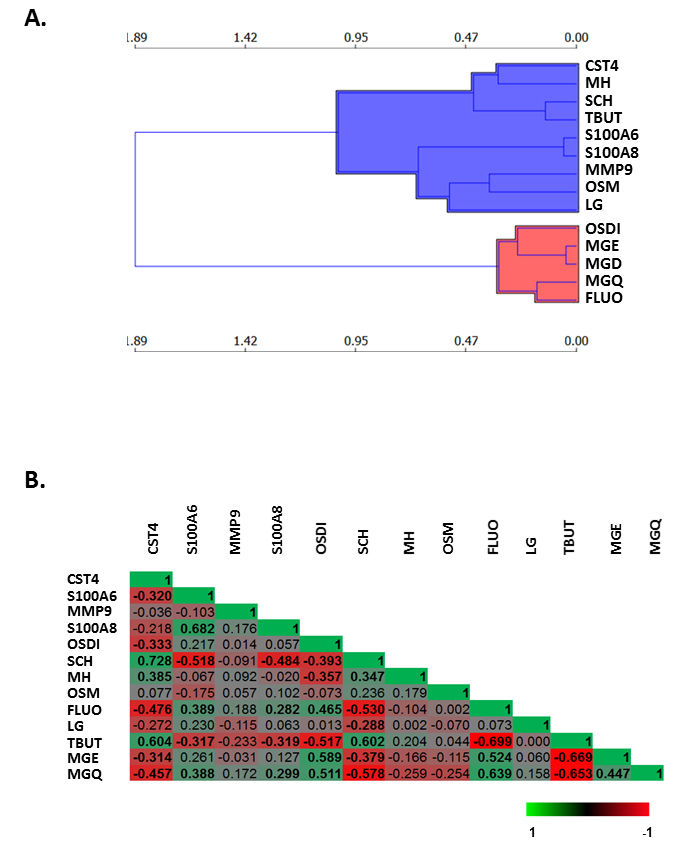
 Figure 3 of
Benitez-del-Castillo, Mol Vis 2021; 27:243-261.
Figure 3 of
Benitez-del-Castillo, Mol Vis 2021; 27:243-261.