Figure 1. Workflow diagram of the experimental strategy used in the study. A: Tear samples were collected twice from each volunteer, with a 15 min interval between samplings. The study had two phases
(see B and C). B: The first single biomarker quantification, using individual ELISA assays, followed by statistical and correlation analyses.
C: The second simultaneous quantification of biomarkers, using multiplexed antibody microarrays. The results obtained using
the two techniques were compared. SC: Standard curve.
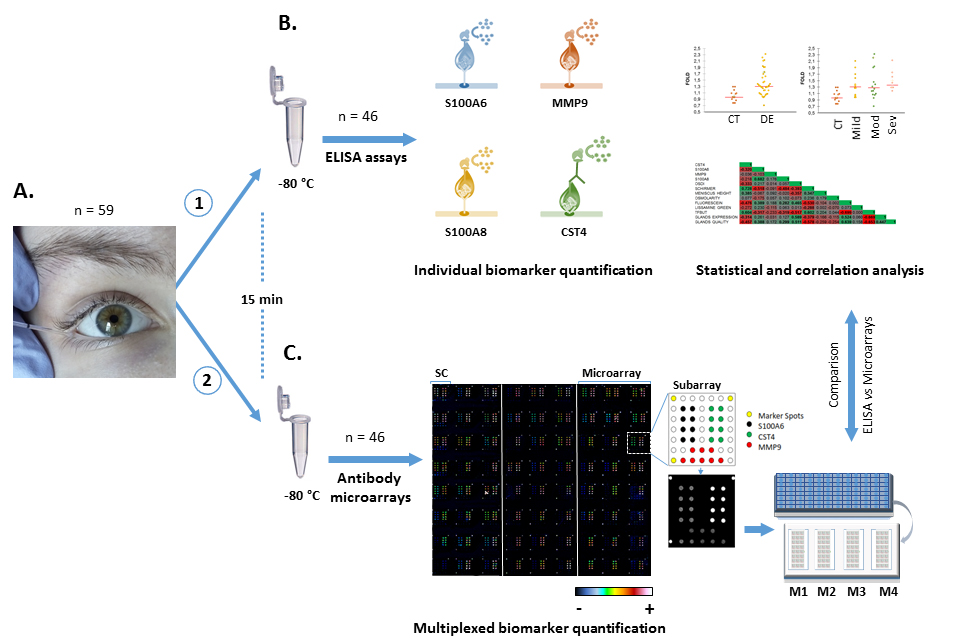
 Figure 1 of
Benitez-del-Castillo, Mol Vis 2021; 27:243-261.
Figure 1 of
Benitez-del-Castillo, Mol Vis 2021; 27:243-261.