Figure 4. Analysis of synaptic proteins of the second synapses in the retina. A: Western blot of synapsin I and synaptophysin. n = 4. *p<0.05. B: In the control retina, intense labeling of synaptophysin is observed in the outer plexiform layer (OPL) and the inner plexiform
layer (IPL). C–F: After light exposure, the intensity of the fluorescence of synaptophysin in the OPL starts to weaken. G: At day 14, the staining of synaptophysin is almost undetectable in the OPL. H: Quantification of the staining intensity of synaptophysin in the IPL. n = 6. **p<0.01. Scale bar: 50 μm.
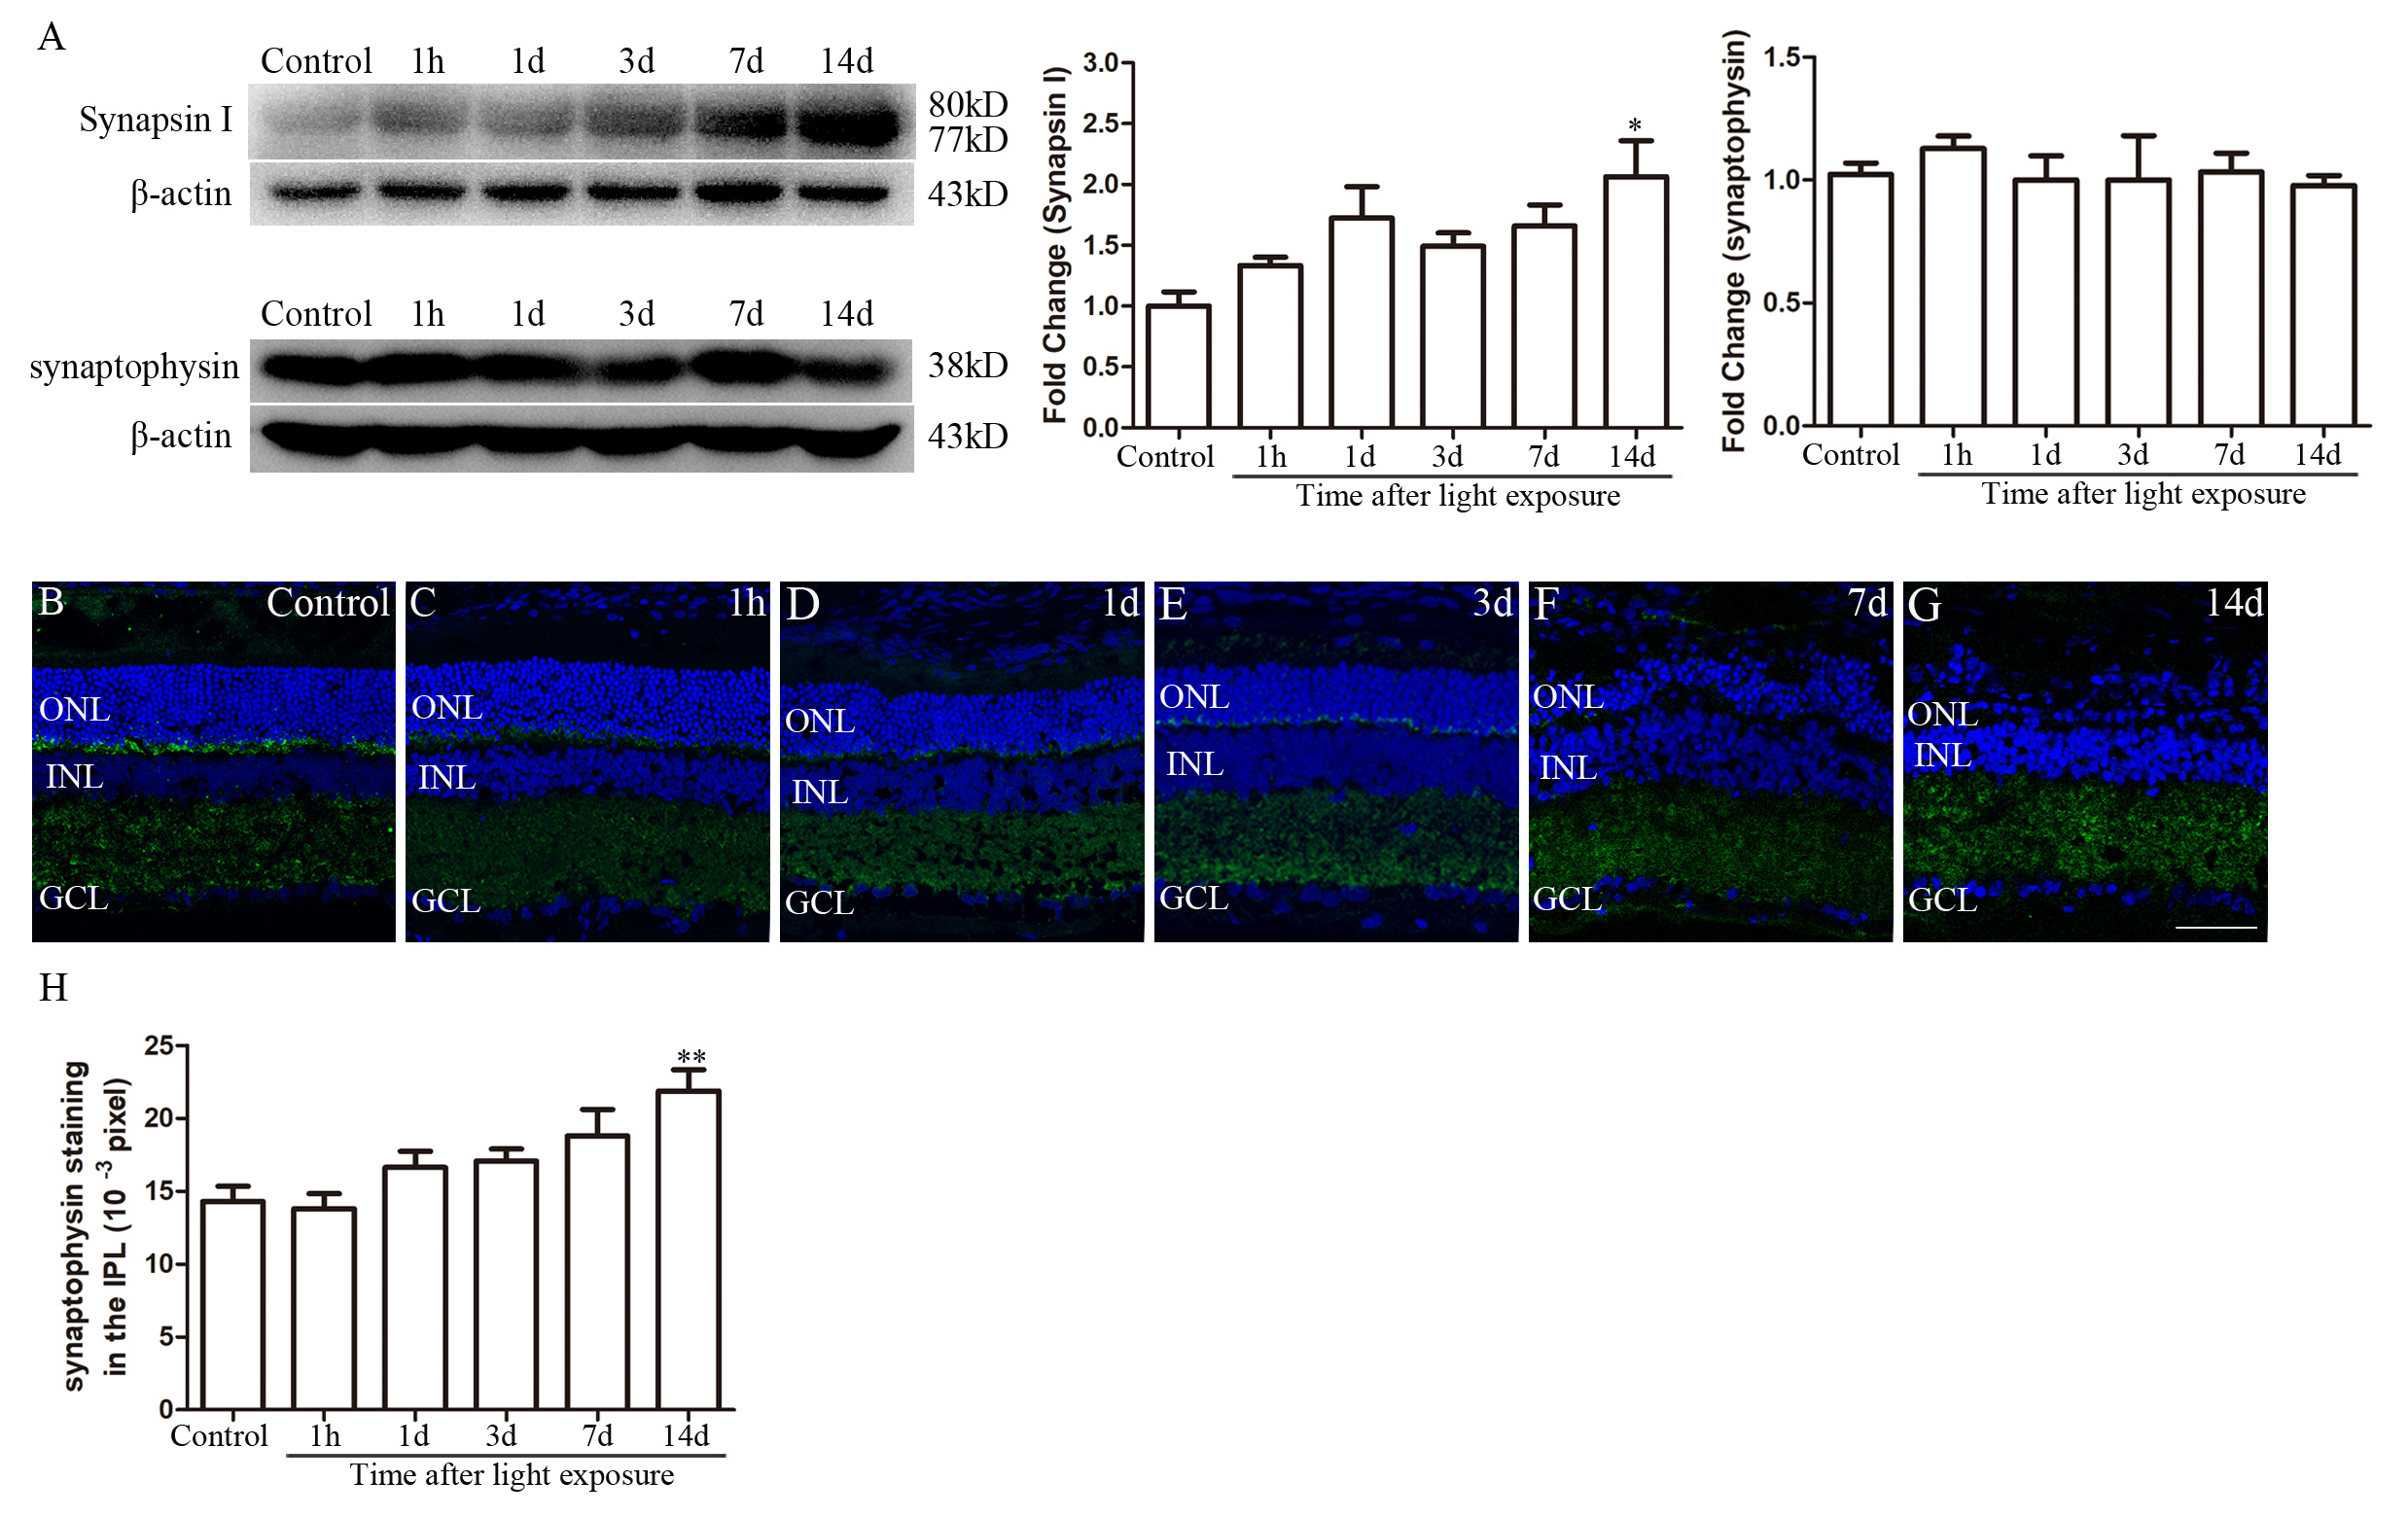
 Figure 4 of
Xu, Mol Vis 2021; 27:206-220.
Figure 4 of
Xu, Mol Vis 2021; 27:206-220.