Figure 1. H&E and TUNEL staining of the retina. A–F: After light exposure, the number of photoreceptors decreases markedly. The thickness of the outer plexiform layer (OPL)
also decreases gradually (arrow). G: In the control retina, positive staining is seldom observed. H: At 1 h after light exposure, positive cells start to appear in the outer nuclear layer (ONL). I: At day 1, the number of positive cells peaks. J–L: The number of positive cells gradually decreases. M: Quantification of the thickness of the ONL. n = 4. **p<0.01. N: Quantification of the thickness of OPL. n = 4. *p<0.05, **p<0.01. Scale bar: 50 μm.
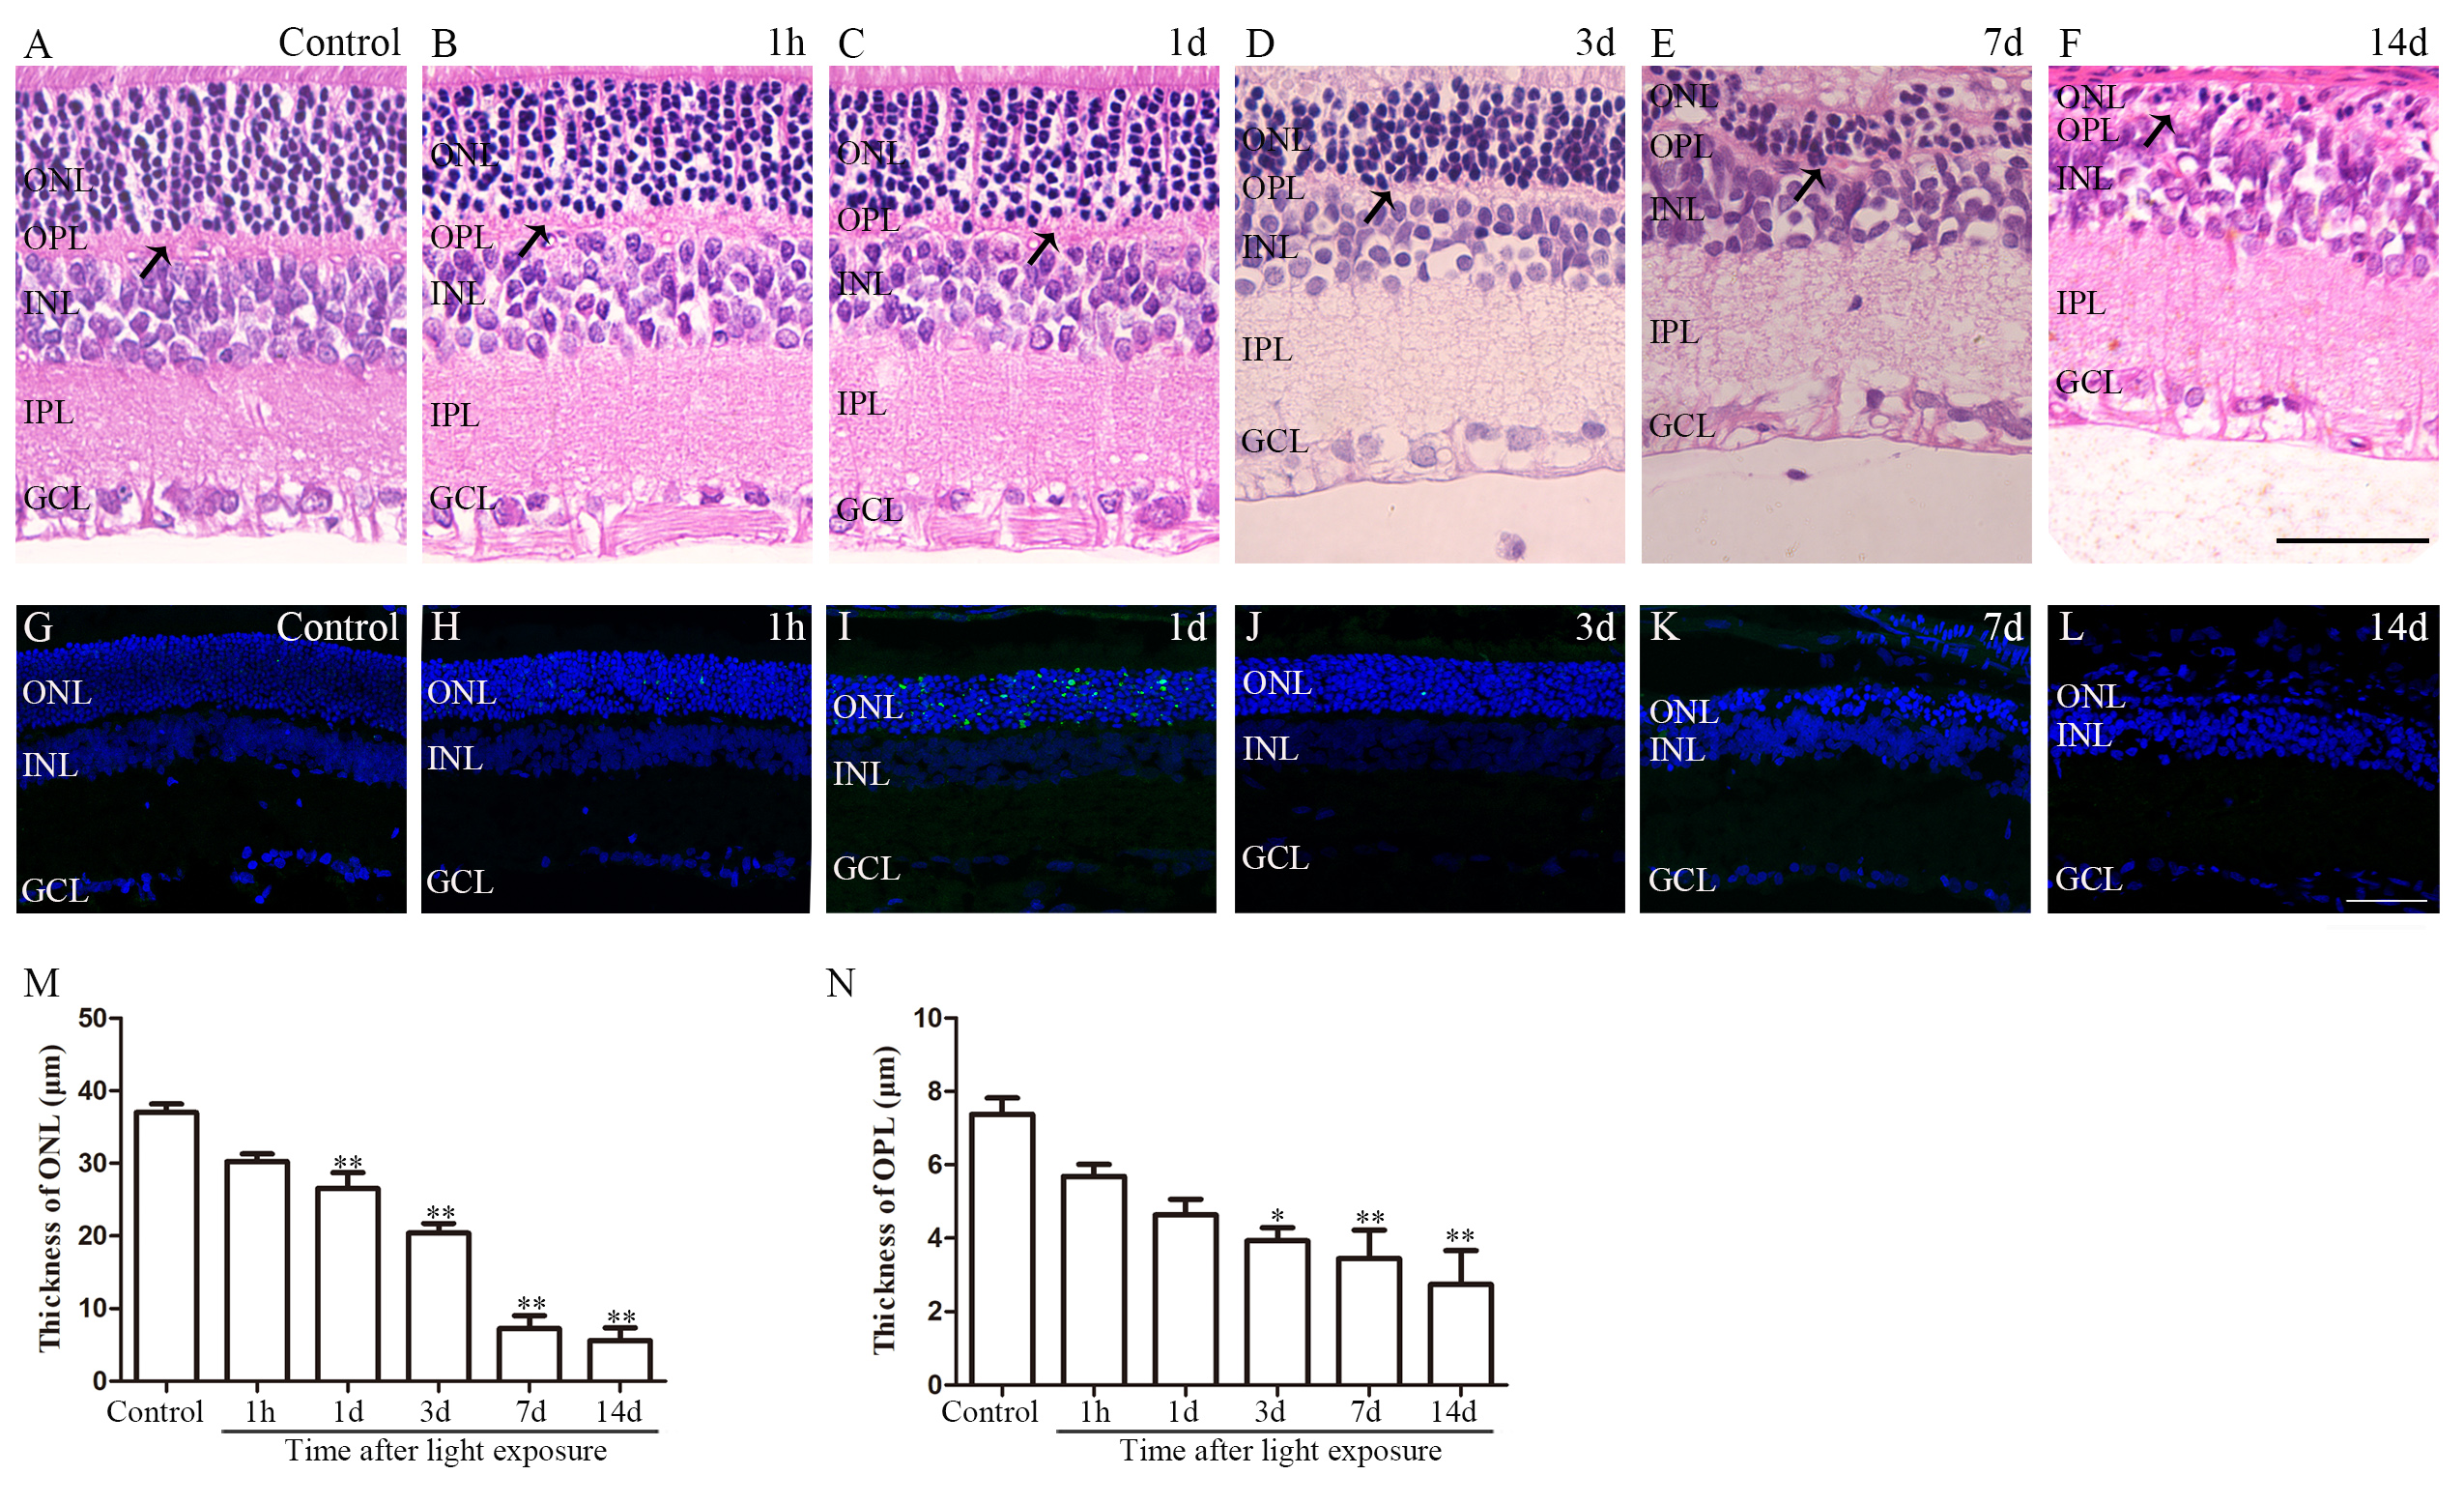
 Figure 1 of
Xu, Mol Vis 2021; 27:206-220.
Figure 1 of
Xu, Mol Vis 2021; 27:206-220.