Figure 4. Characterization of the P388S TULP1 variant. A: Western blot of wild-type (WT) and P388S TULP1 enhanced green fluorescent protein (eGFP) levels in soluble and insoluble
fractions. B: Quantification of WT and P388S TULP1 eGFP expression in soluble and insoluble fractions of western blot in (A), n≥5, mean ± standard deviation (SD; **p<0.01, one-sample t test versus hypothetical value of 1 [i.e., unchanged]). C: Quantitative PCR (qPCR) of TULP1 mRNA expression from WT TULP1 eGFP- and P388S TULP1 eGFP-transfected HEK-293A cells. Representative
data of n≥3 independent experiments, mean ± SD; n.s., not significant.
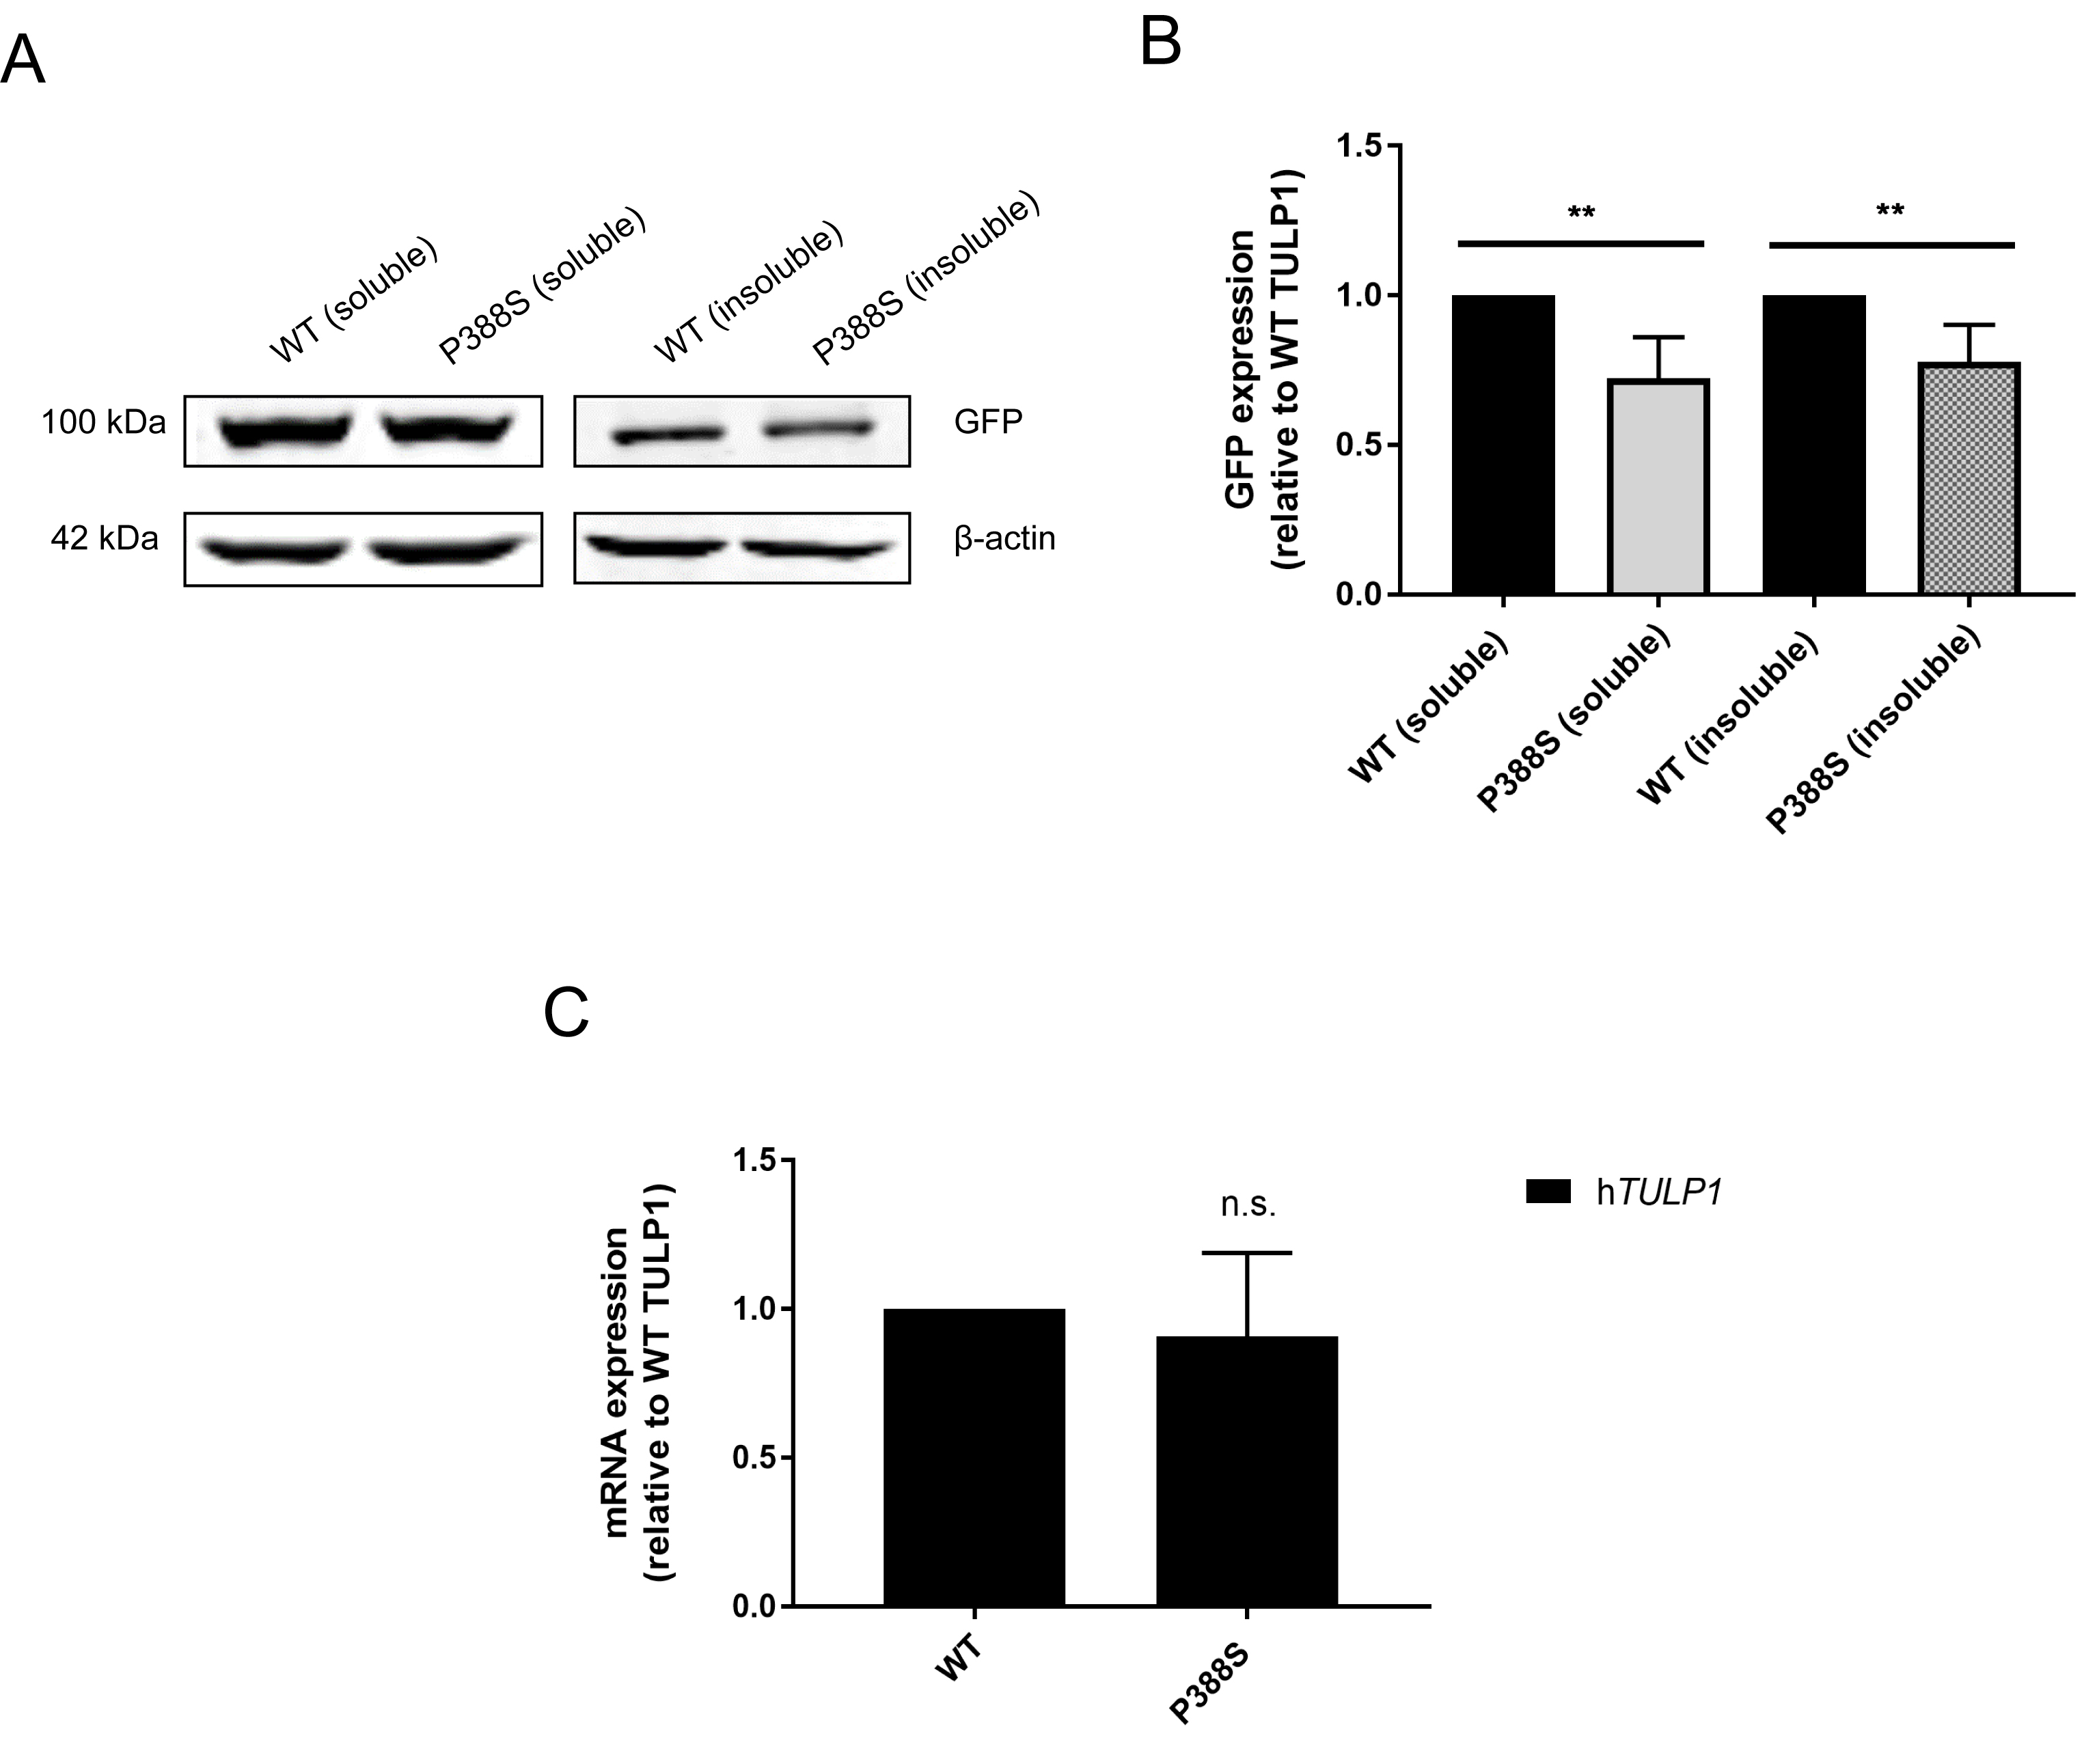
 Figure 4 of
Woodard, Mol Vis 2021; 27:179-190.
Figure 4 of
Woodard, Mol Vis 2021; 27:179-190.