Figure 7. Protein expression of antioxidant enzymes. Relative protein expression of (A) GSH-Px 1/2, (B) GSH-Red, and (C) SOD-1 in eyecup homogenates from normotensive (CONTROL) and hypertensive (Nω-nitro-L-arginine methyl ester, L-NAME) rats.
The quantitative fold changes in protein expression were determined relative to the GAPDH protein levels in each corresponding
group. Plotted values are expressed as mean ± standard error of the mean (SEM) of seven animals per group, and three western
blots per group are shown as a representation of all animal samples processed. *p<0.05, ***p<0.001 versus control group.
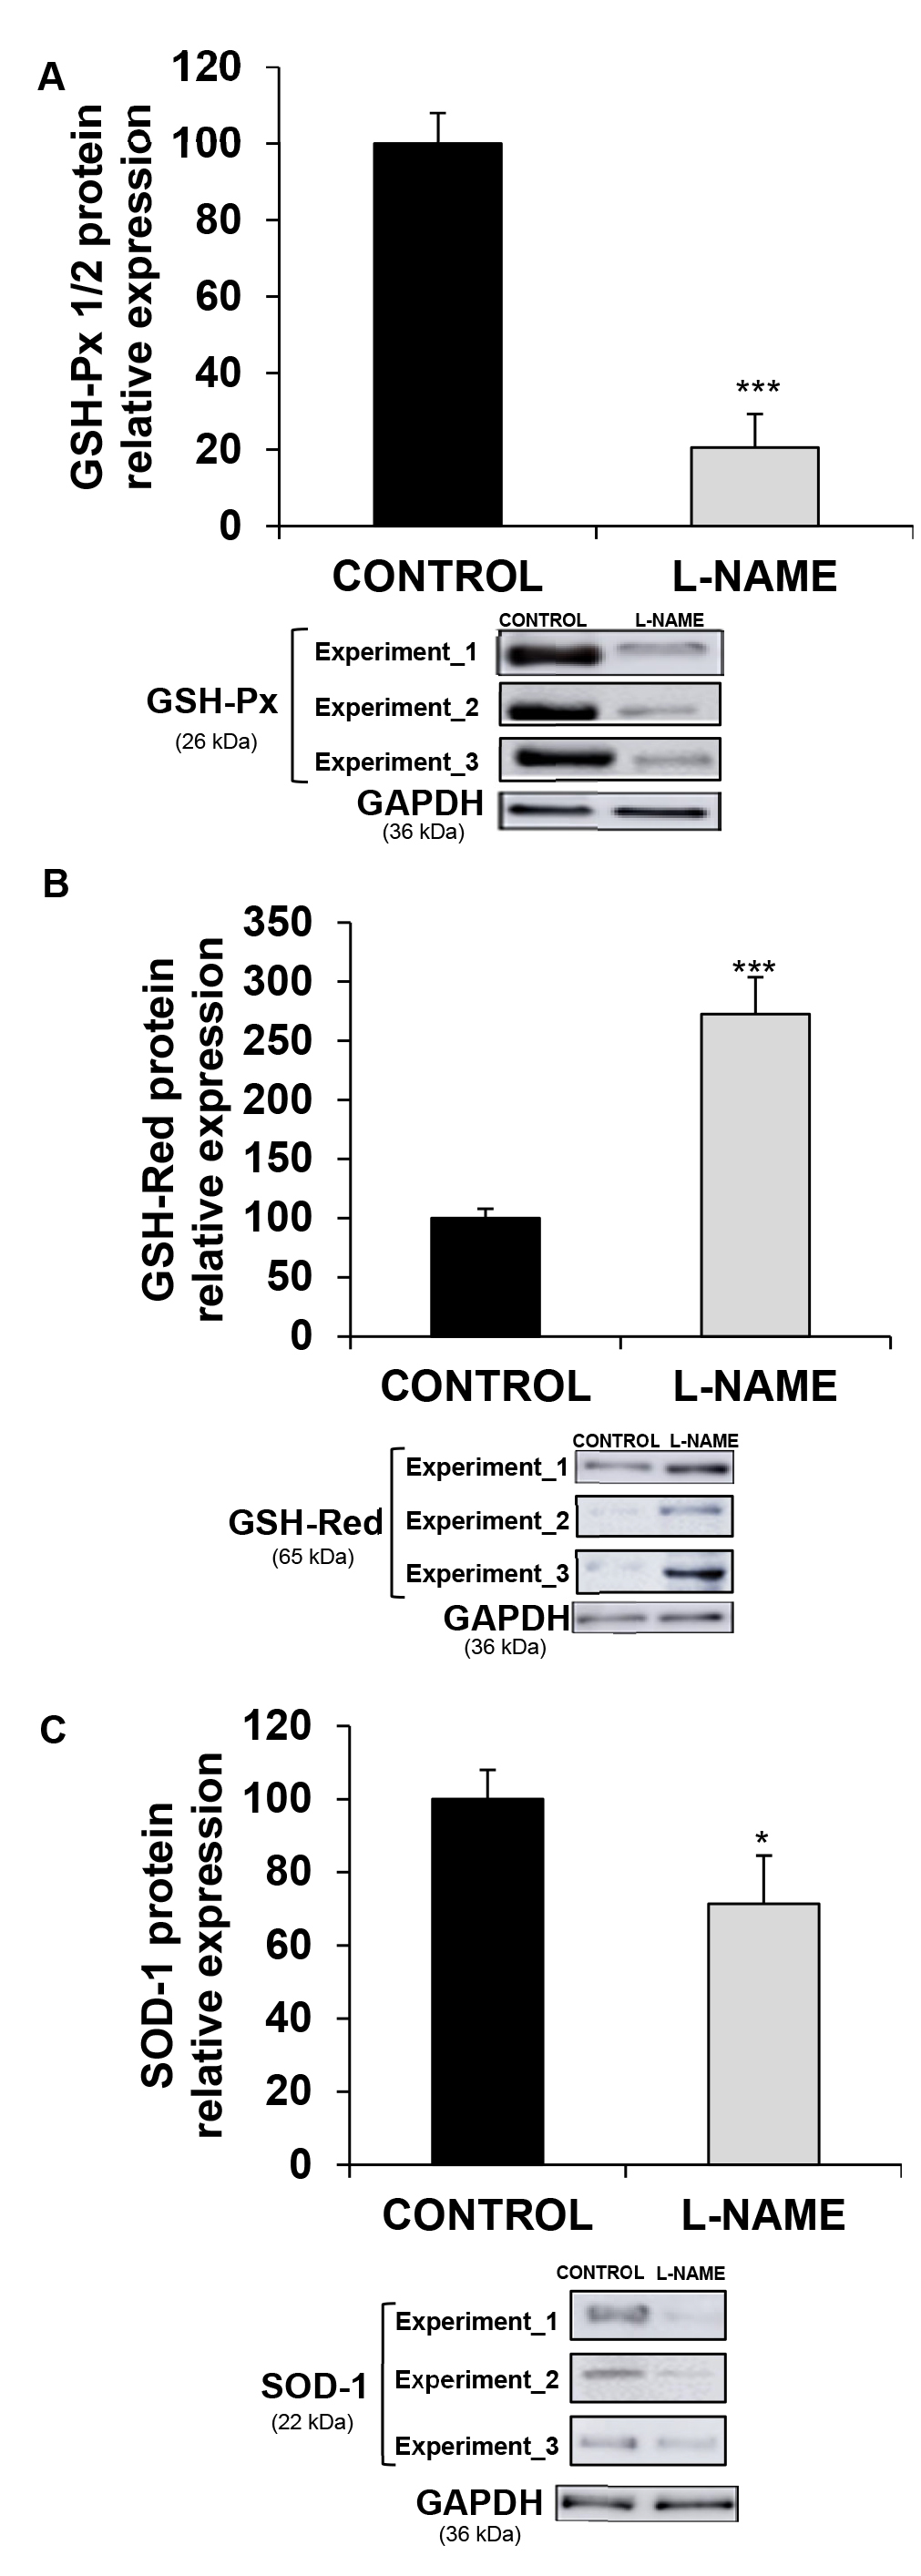
 Figure 7 of
Santana-Garrido, Mol Vis 2021; 27:161-178.
Figure 7 of
Santana-Garrido, Mol Vis 2021; 27:161-178.