Figure 5. Expresion of nitric oxide synthases and protein tyrosine nitration. Relative protein expression of (A) NOX1, (B) NOX2, (C) NOX4, (D) p22phox, and (E) p47phox, in eyecup homogenates, and (H) GFAP in retinas from normotensive (CONTROL) and hypertensive (Nω-nitro-L-arginine methyl ester, L-NAME) rats. The quantitative
fold changes in protein expression were determined relative to GAPDH protein levels in each corresponding group. Plotted values
are expressed as mean ± standard error of the mean (SEM) of seven animals per group. *p<0.05, **p<0.01, ***p<0.001 versus
the CONTROL group. F: Double-immunostaining of nuclei (blue) and NOX isoforms (red; NOX1 (top), NOX2 (middle), and NOX4 (bottom)) proteins in
retinal layers and in RPE/choroid layers from control (left column) and L-NAME-treated rats (right column). Arrow heads indicate
the presence of NOX proteins mainly around choroidal vessels. Images are representative of four animals per group. G: Double immunostaining of nuclei (blue) and GFAP (red) proteins in retinal layers from control (left column) and L-NAME-treated
rats (right column). Three immunostained images and western blots per group are shown as a representation of all animal samples
processed. GCL, ganglion cell layer; IPL, inner plexiform layer; INL, inner nuclear layer; OPL, outer plexiform layer; ONL,
outer nuclear layer; OS, outer segments; RPE, retinal pigment epithelium; CH, choroid.
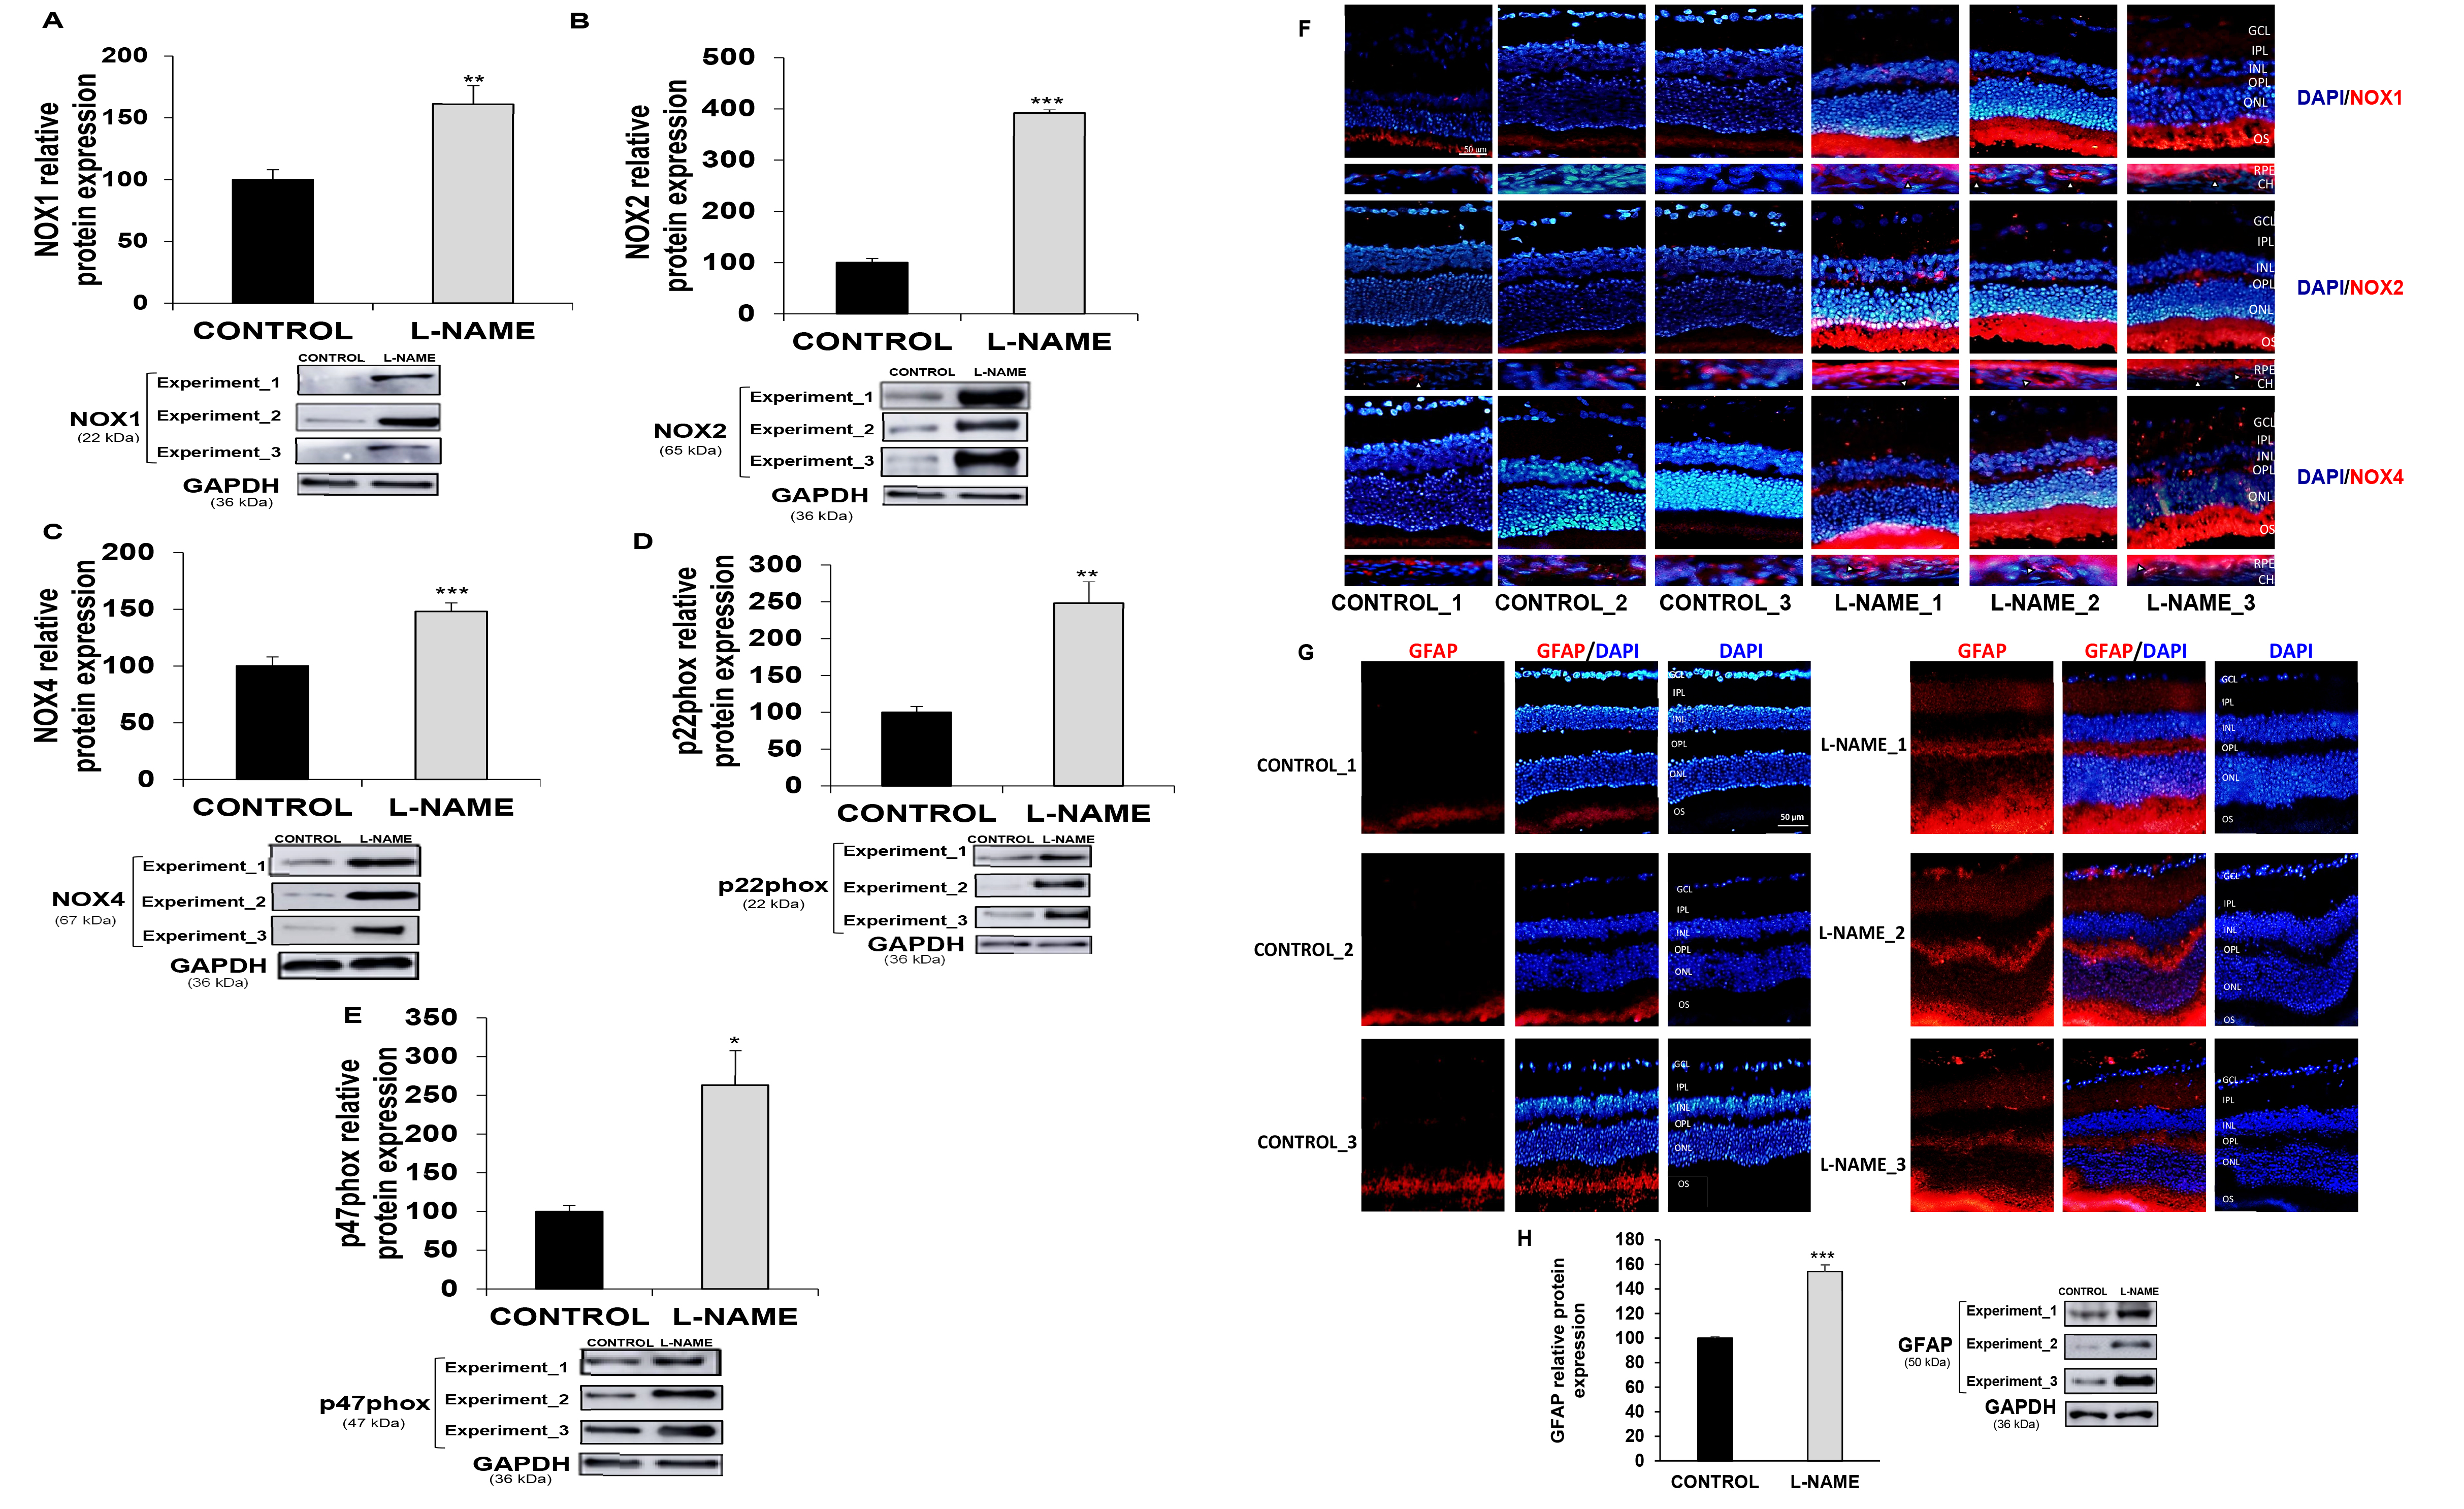
 Figure 5 of
Santana-Garrido, Mol Vis 2021; 27:161-178.
Figure 5 of
Santana-Garrido, Mol Vis 2021; 27:161-178.