Figure 2. Effect of L-NAME on ROS production. A: NADPH oxidase activity in eyecup homogenates from normotensive (CONTROL) and hypertensive (Nω-nitro-L-arginine methyl ester,
L-NAME) rats. Values are expressed as mean ± standard error of the mean (SEM) of seven animals per group. ***p<0.001 versus
the CONTROL group. B: NADPH oxidase–mediated production of the superoxide anion. Eyecup homogenates from L-NAME-treated rats were used for NADPH
oxidase chemiluminescence assay in the presence of 0.1 mM diphenyleneiodonium (DPI), oxypurinol (OXI), and rotenone (ROT)
inhibitors. Values were subjected to one-way analysis of variance (ANOVA) followed by Tukey’s multiple comparison posttest
and are expressed as mean ± SEM of seven animals per group. ***p<0.001 versus the CONTROL group; ###p<0.001 versus the L-NAME group. C, D: Estimation of reactive oxygen species (ROS) levels in the retina and choroid with dihydroethidium (DHE) staining. C: DHE labeling (red) for ROS was present in the ganglion cell layer (GCL), in the inner nuclear layer (INL), and in the outer
nuclear layer (ONL) of the retina, and in the choroid (CH), which can be distinguished with 4′,6-diamidino-2-phenylindole
(DAPI, blue) nuclei staining. Three images per group are shown as a representation of all animal samples processed. D: Fluorescence intensity in (C) normalized to that of the CONTROL group in each corresponding layer, as quantified using ImageJ software. Plotted values
are expressed as mean ± SEM of four animals per group: **p<0.01, ***p<0.001 versus the CONTROL group. RFU, relative fluorescence
unit.
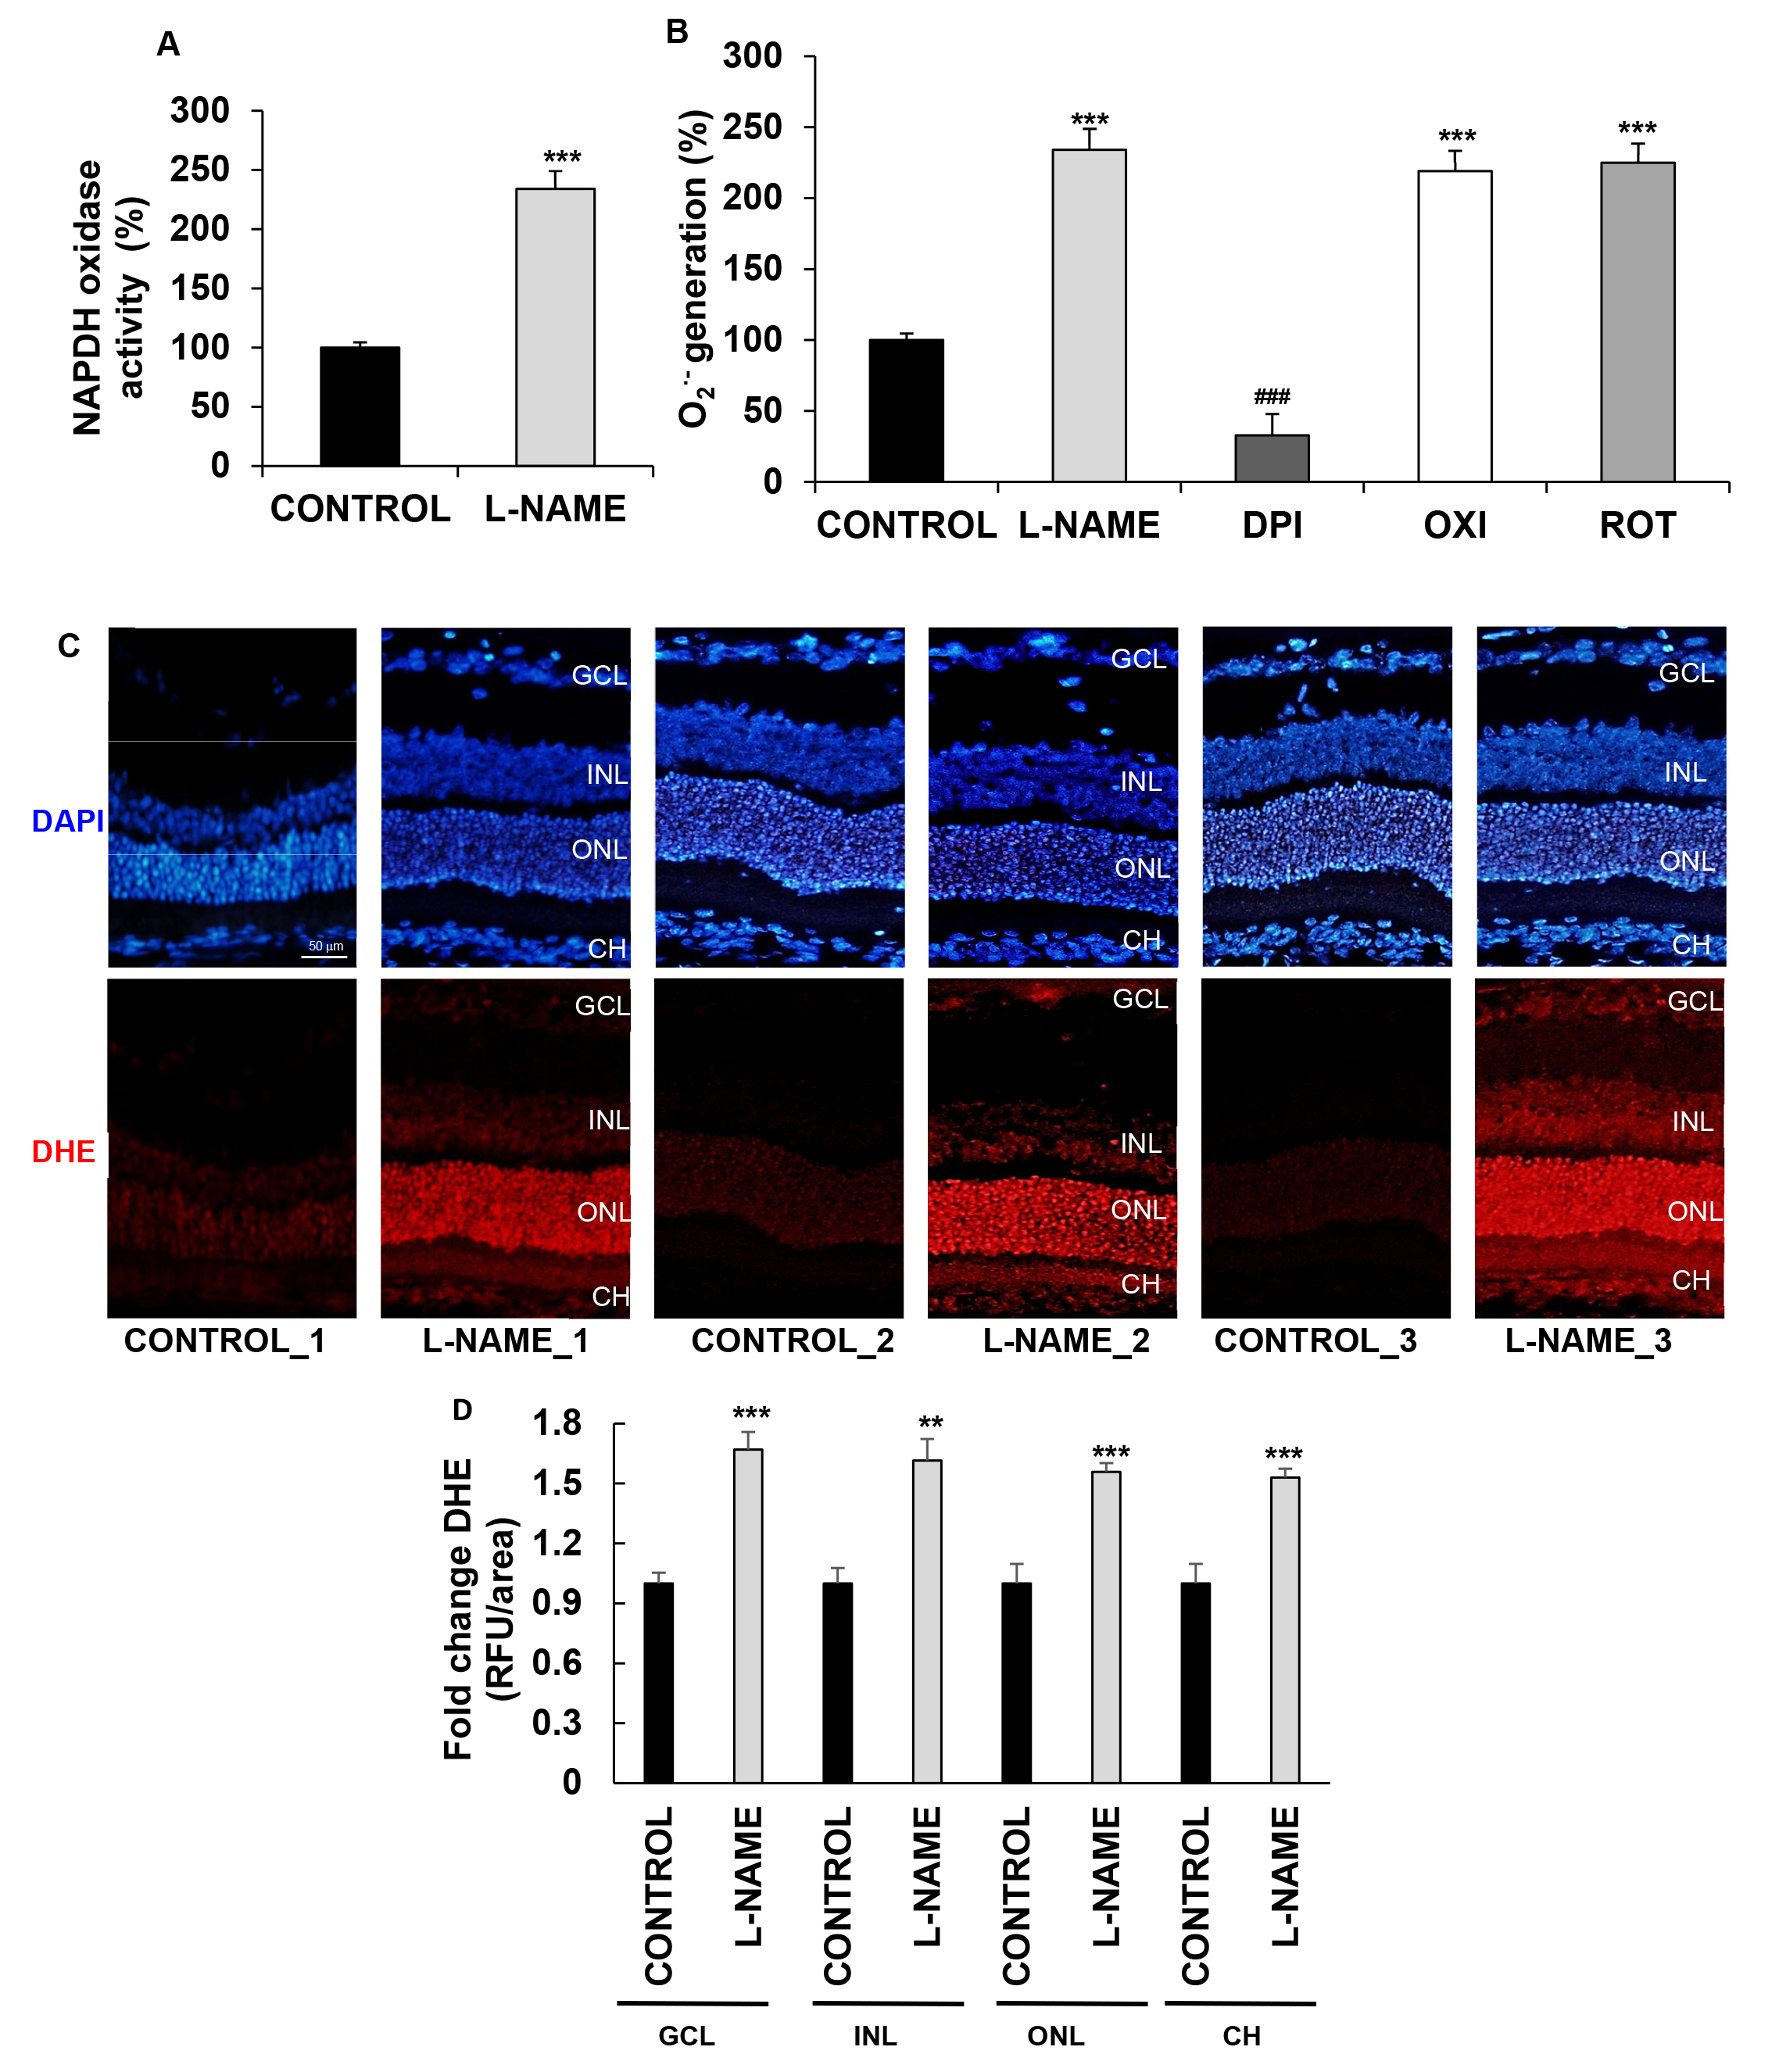
 Figure 2 of
Santana-Garrido, Mol Vis 2021; 27:161-178.
Figure 2 of
Santana-Garrido, Mol Vis 2021; 27:161-178.