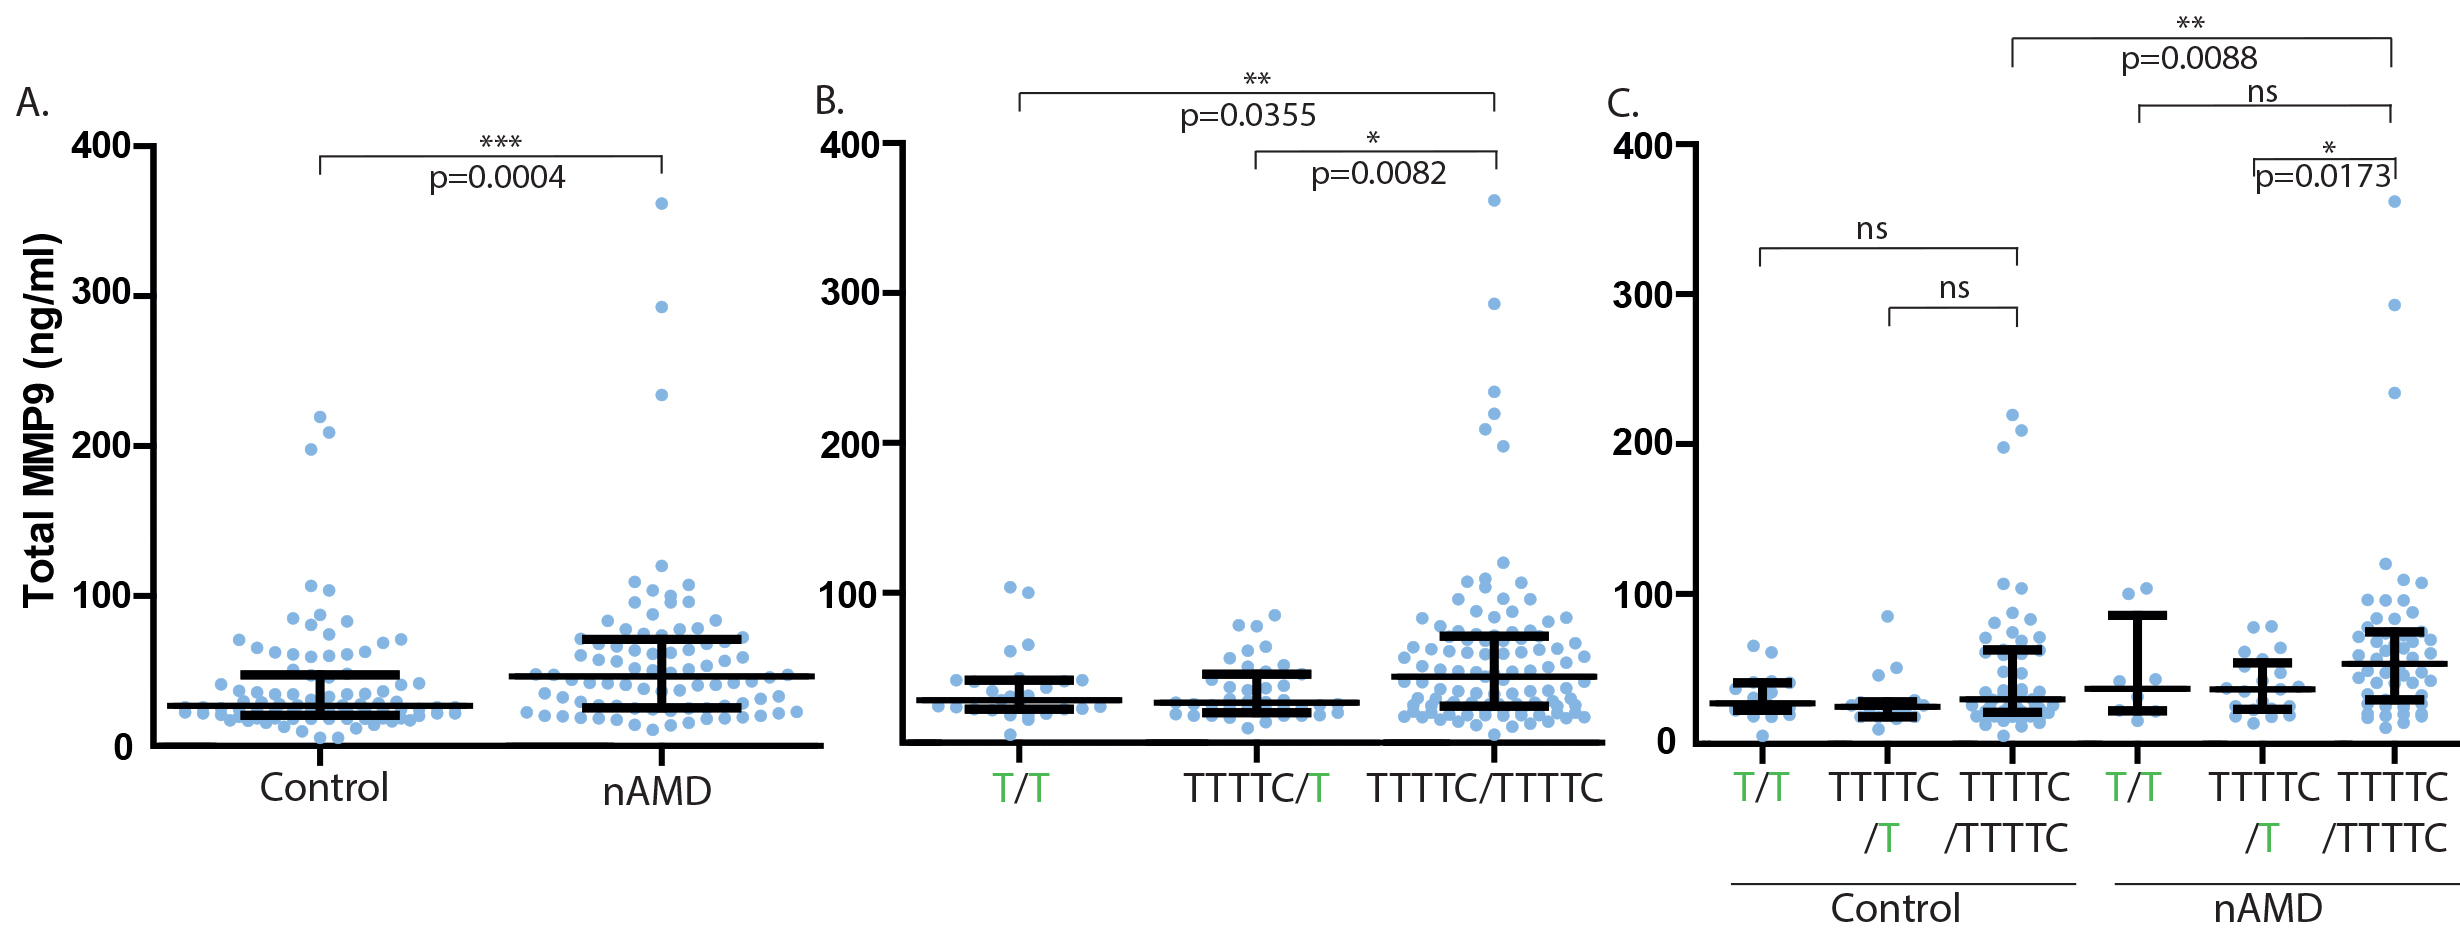
Figure 1. Total MMP9 levels in plasma samples of nAMD patients and controls.
A: Comparison of total MMP9 levels in nAMD patients and controls.
B: Total MMP9 levels in nAMD patients and controls mixed stratified by
rs142450006 genotype.
C: Total MMP9 levels in nAMD patients and controls separately and stratified by rs142450006 genotype. The non-risk allele of
rs142450006 is depicted in green. Bars represent median values, and whiskers represent interquartile ranges.
 Figure 1 of
Lauwen, Mol Vis 2021; 27:142-150.
Figure 1 of
Lauwen, Mol Vis 2021; 27:142-150.