Figure 4. Ex vivo OCT and SEM in goat eyeballs upon VMA treatment. A: Schematic representation of the experimental setup. B, C: Scanning electron microscopy (SEM) micrographs showing dense collagen fibrils on the retinal surface of the control eye.
D, E: SEM micrographs corresponding to eyes treated with Vibrio mimicus collagenase that remains active (VMA), showing disorganization of the collagen matrix (D) or clearing of collagen fibers (E). F, G: Representative optical coherence tomography (OCT) images of control eyes injected with saline, showing no posterior vitreous
detachment (PVD). H, I: Representative OCT images upon treatment with 750 μU (H) and 900 μU of VMA (I), respectively, showing detachment of the posterior hyaloid membrane of the vitreous from the inner limiting membrane (ILM)
of the retina (shown by arrows). Scale bar: 10 µm.
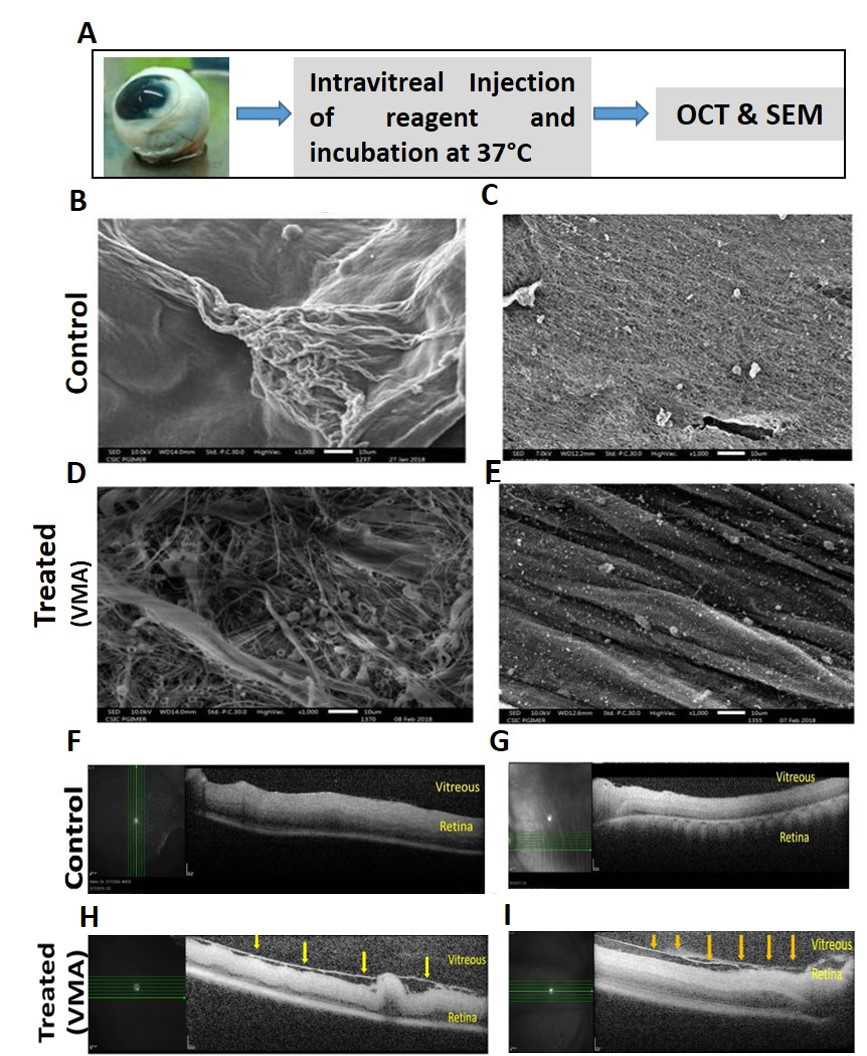
 Figure 4 of
Santra, Mol Vis 2021; 27:125-141.
Figure 4 of
Santra, Mol Vis 2021; 27:125-141.