Figure 3. Schematic representation of the PRPF31 region and of the deletions identified. The structure of the PRPF31 (green) and TFPT (red) genes is indicated (introns, lines; noncoding exons, light-blue boxes; coding exons, dark blue boxes). The deletions
detected in families MOL0931 and TB228 are indicated by the black lines. Repeated DNA elements are indicated by boxes in color
(SINE, short interspersed nuclear elements; LINE, long interspersed nuclear elements; LTR, long-terminal repeats; SAT, microsatellites).
Results of real-time PCRs on the genomic DNA from members of the MOL0931 family are shown by the graphs at the bottom, indicating
the presence of two DNA copies (+/+) or one DNA copy of the region investigated (+/−). Because of space constraints, only
eight primer pairs of the 12 used are depicted in this image. TEL, telomere; CEN, centromere.
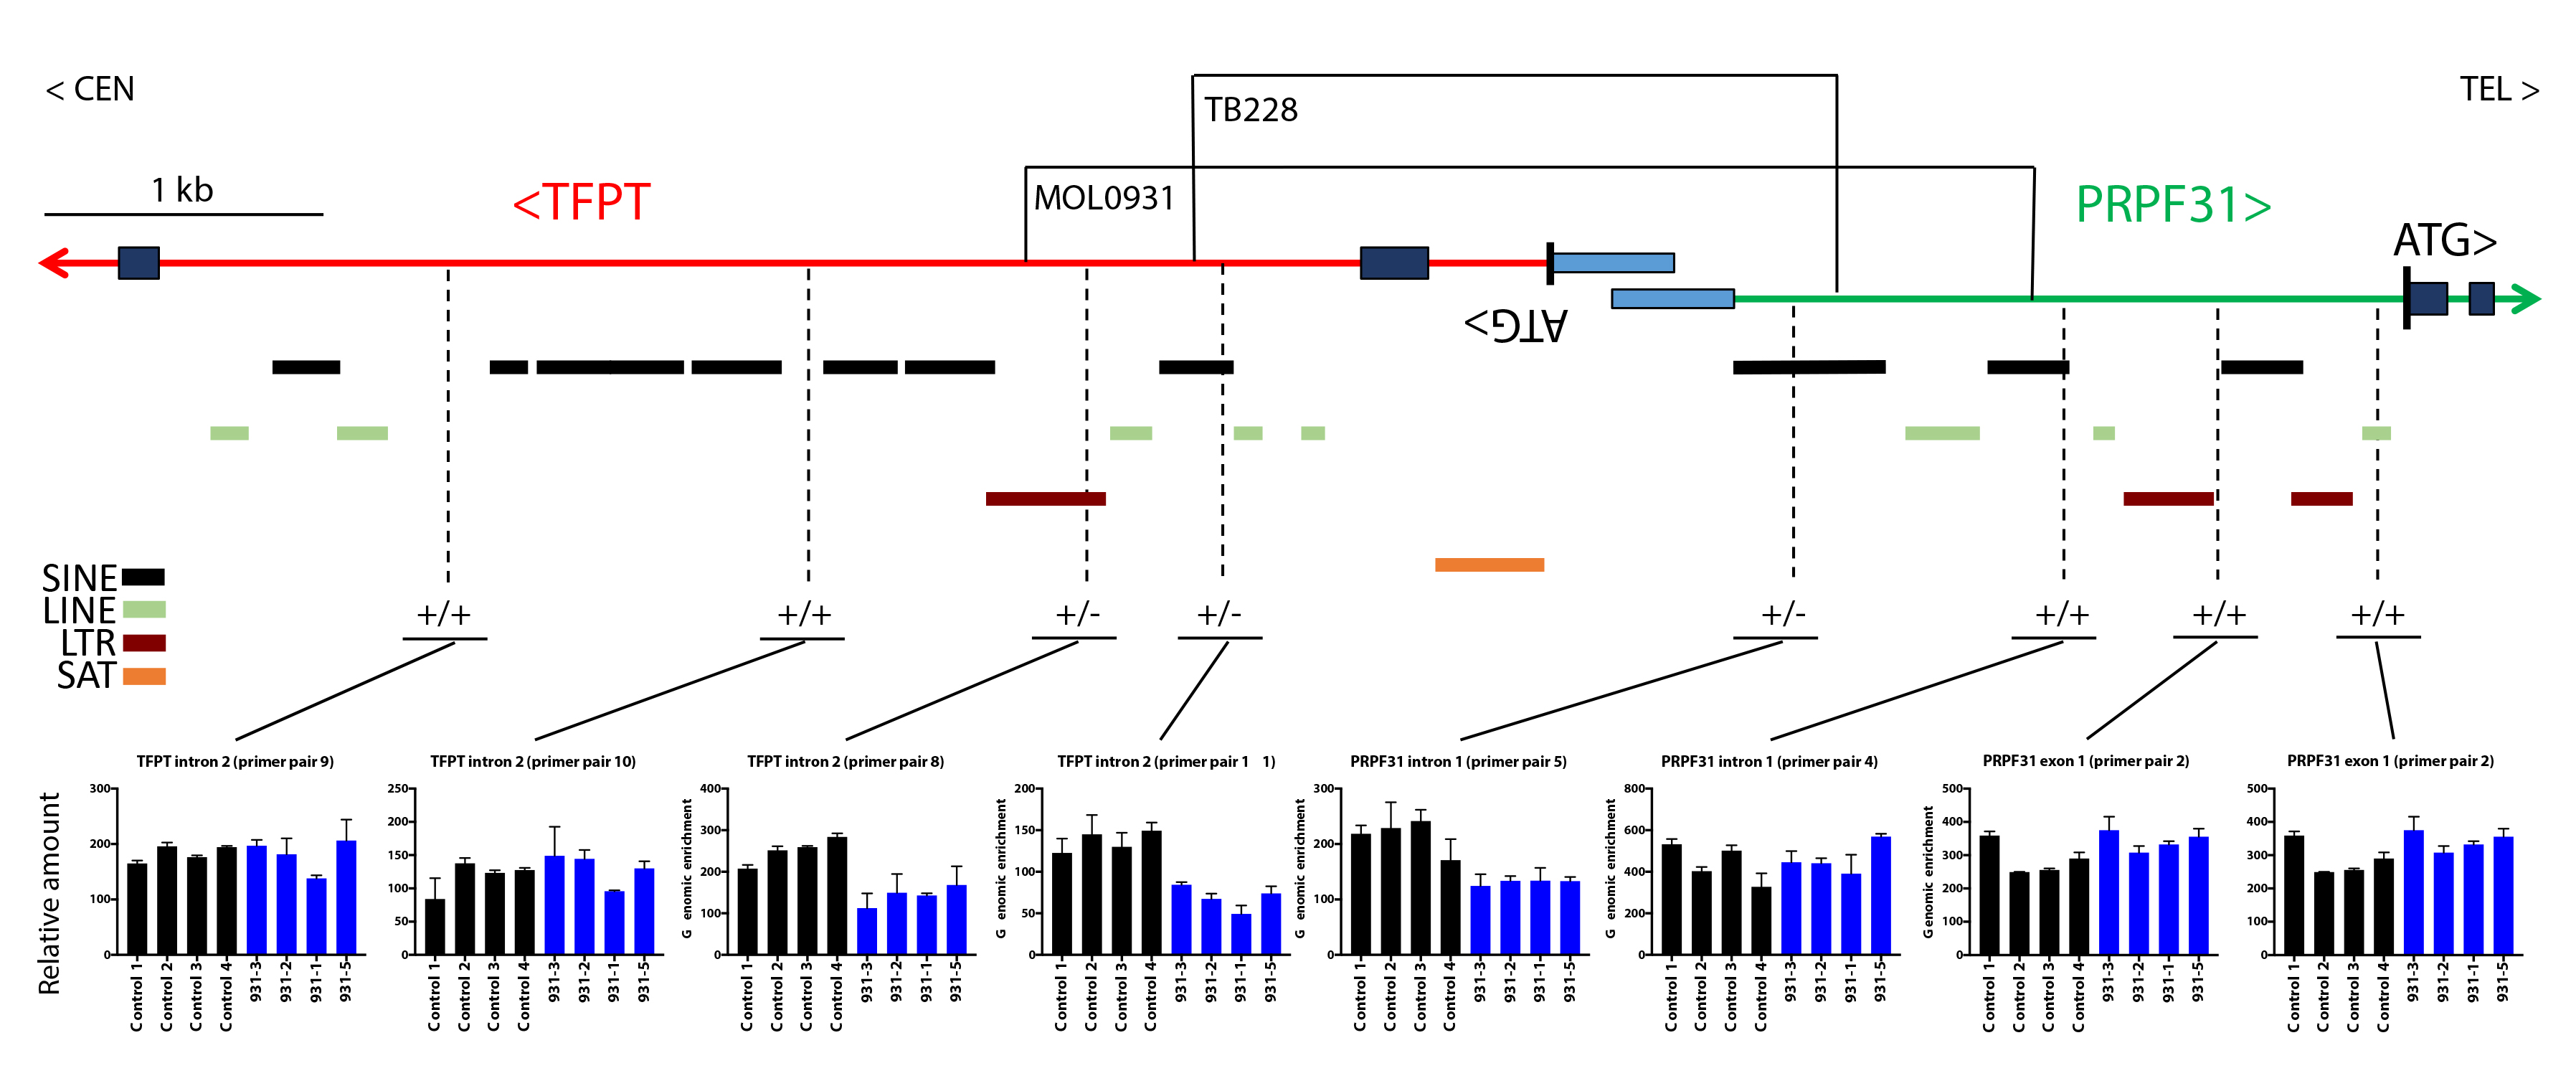
 Figure 3 of
Ruberto, Mol Vis 2021; 27:107-116.
Figure 3 of
Ruberto, Mol Vis 2021; 27:107-116.