Figure 1. The distribution of detected mutations in the RB1 gene. Mutation types in the 27 exons and splice sites of the gene are described.
The two oval grey regions represent the functional domains A and B; the numbers in boxes refer to the exons. The five symbols
denote five various mutation types; the lines above or below the gene schematic refer to 3 types of pathogenicity of mutations.
Copy number variations (CNVs) of the RB1 gene are presented as the grey bars.
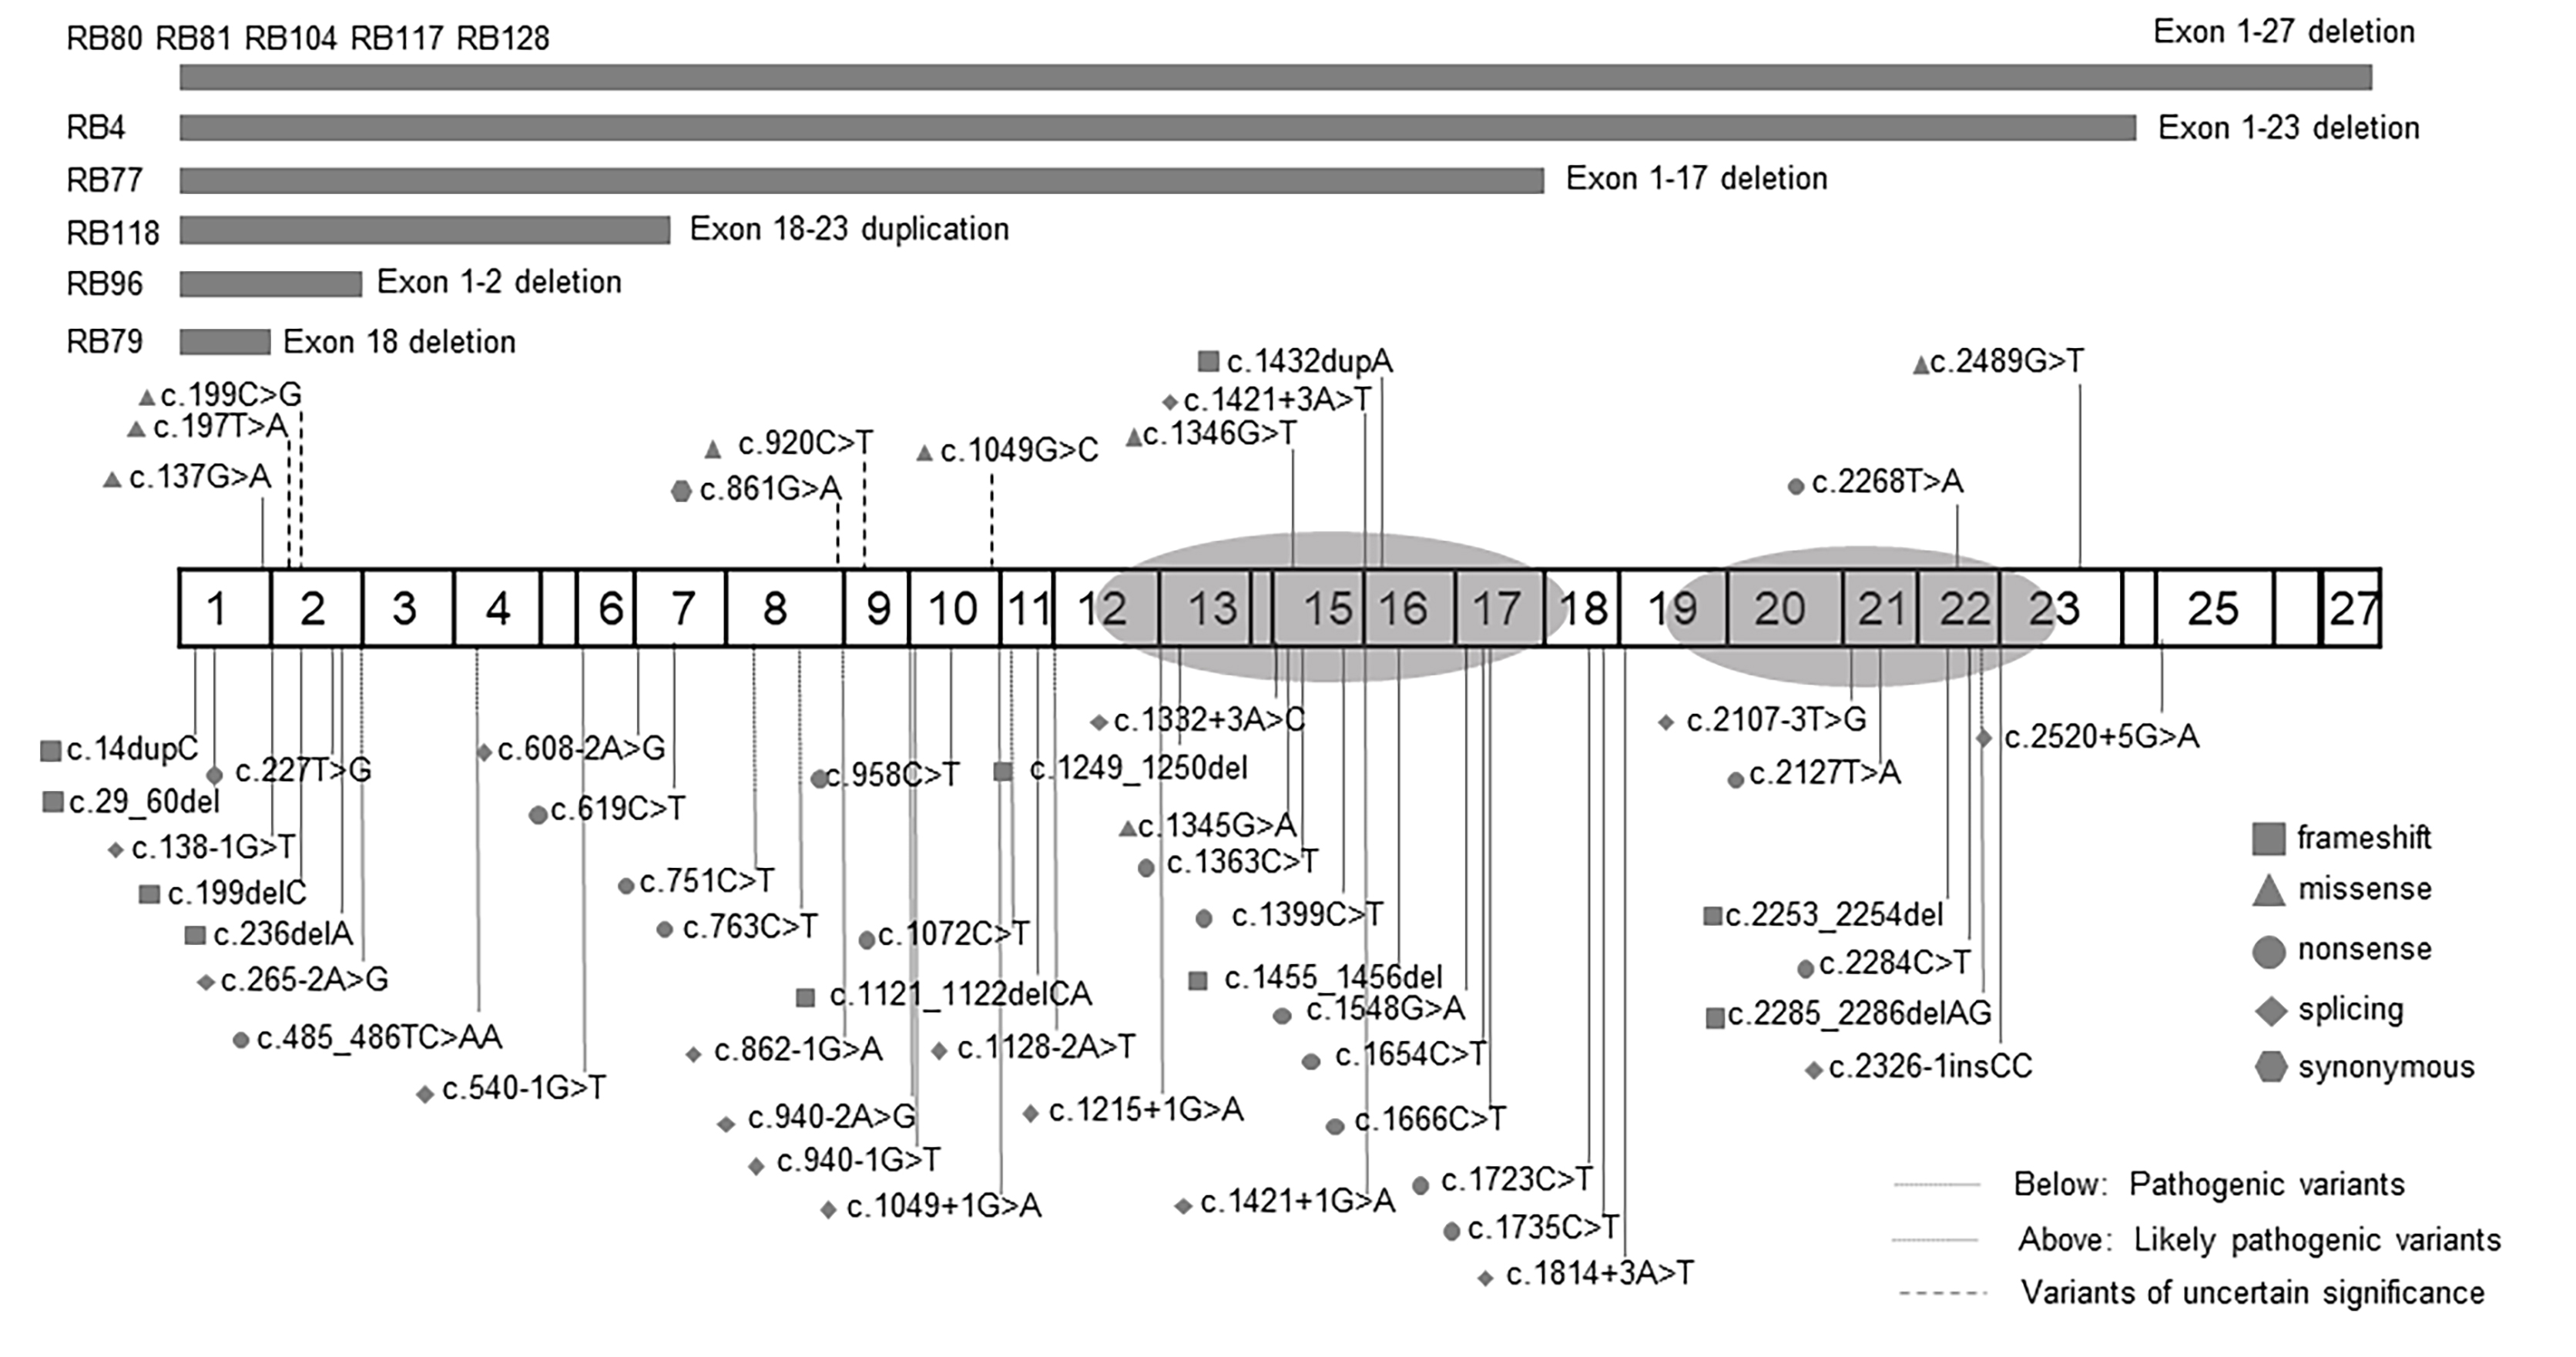
 Figure 1 of
Zou, Mol Vis 2021; 27:1-16.
Figure 1 of
Zou, Mol Vis 2021; 27:1-16.