Figure 7. Expression of KATP channel subunits in human RPE cells. A: Presence of Kir6.1 and SUR2B gene transcripts in acutely isolated (a) and cultured (c) human RPE cells, as determined with RT–PCR analysis. The correct
lengths of the PCR products were confirmed with agarose gel electrophoresis using products obtained from cell lines of four
different donors. Negative controls (0) were performed with double-distilled water instead of cDNA as the template. ACTB mRNA was used as loading control. B: Relative levels of Kir6.1 and Kir6.2 transcripts in acutely isolated (a) and cultured (c) RPE cells. The levels are shown as normalized cycle thresholds (ΔCT)
required to detect the mRNA in real-time RT–PCR analysis. C: Effect of high (+ 100 mM) NaCl on the expression levels of Kir6.1 and SUR2B genes. The mRNA levels were determined with real-time RT–PCR analysis in cells cultured for 2, 6, and 24 h in the hyperosmotic
medium (as indicated by the panels of the bars), and are expressed as folds of unstimulated control. D: Cultured RPE cells were immunolabeled with an antibody against Kir6.1 (red). Cell nuclei were stained with 4’,6-diamidine-2-phenylindol
(DAPI; blue). Scale bar, 20 µm. In B and C, each bar represents mean ± standard error of the mean (SEM) obtained in four to six independent experiments using cell lines
from different donors. Significant difference vs. unstimulated control: *p<0.05.
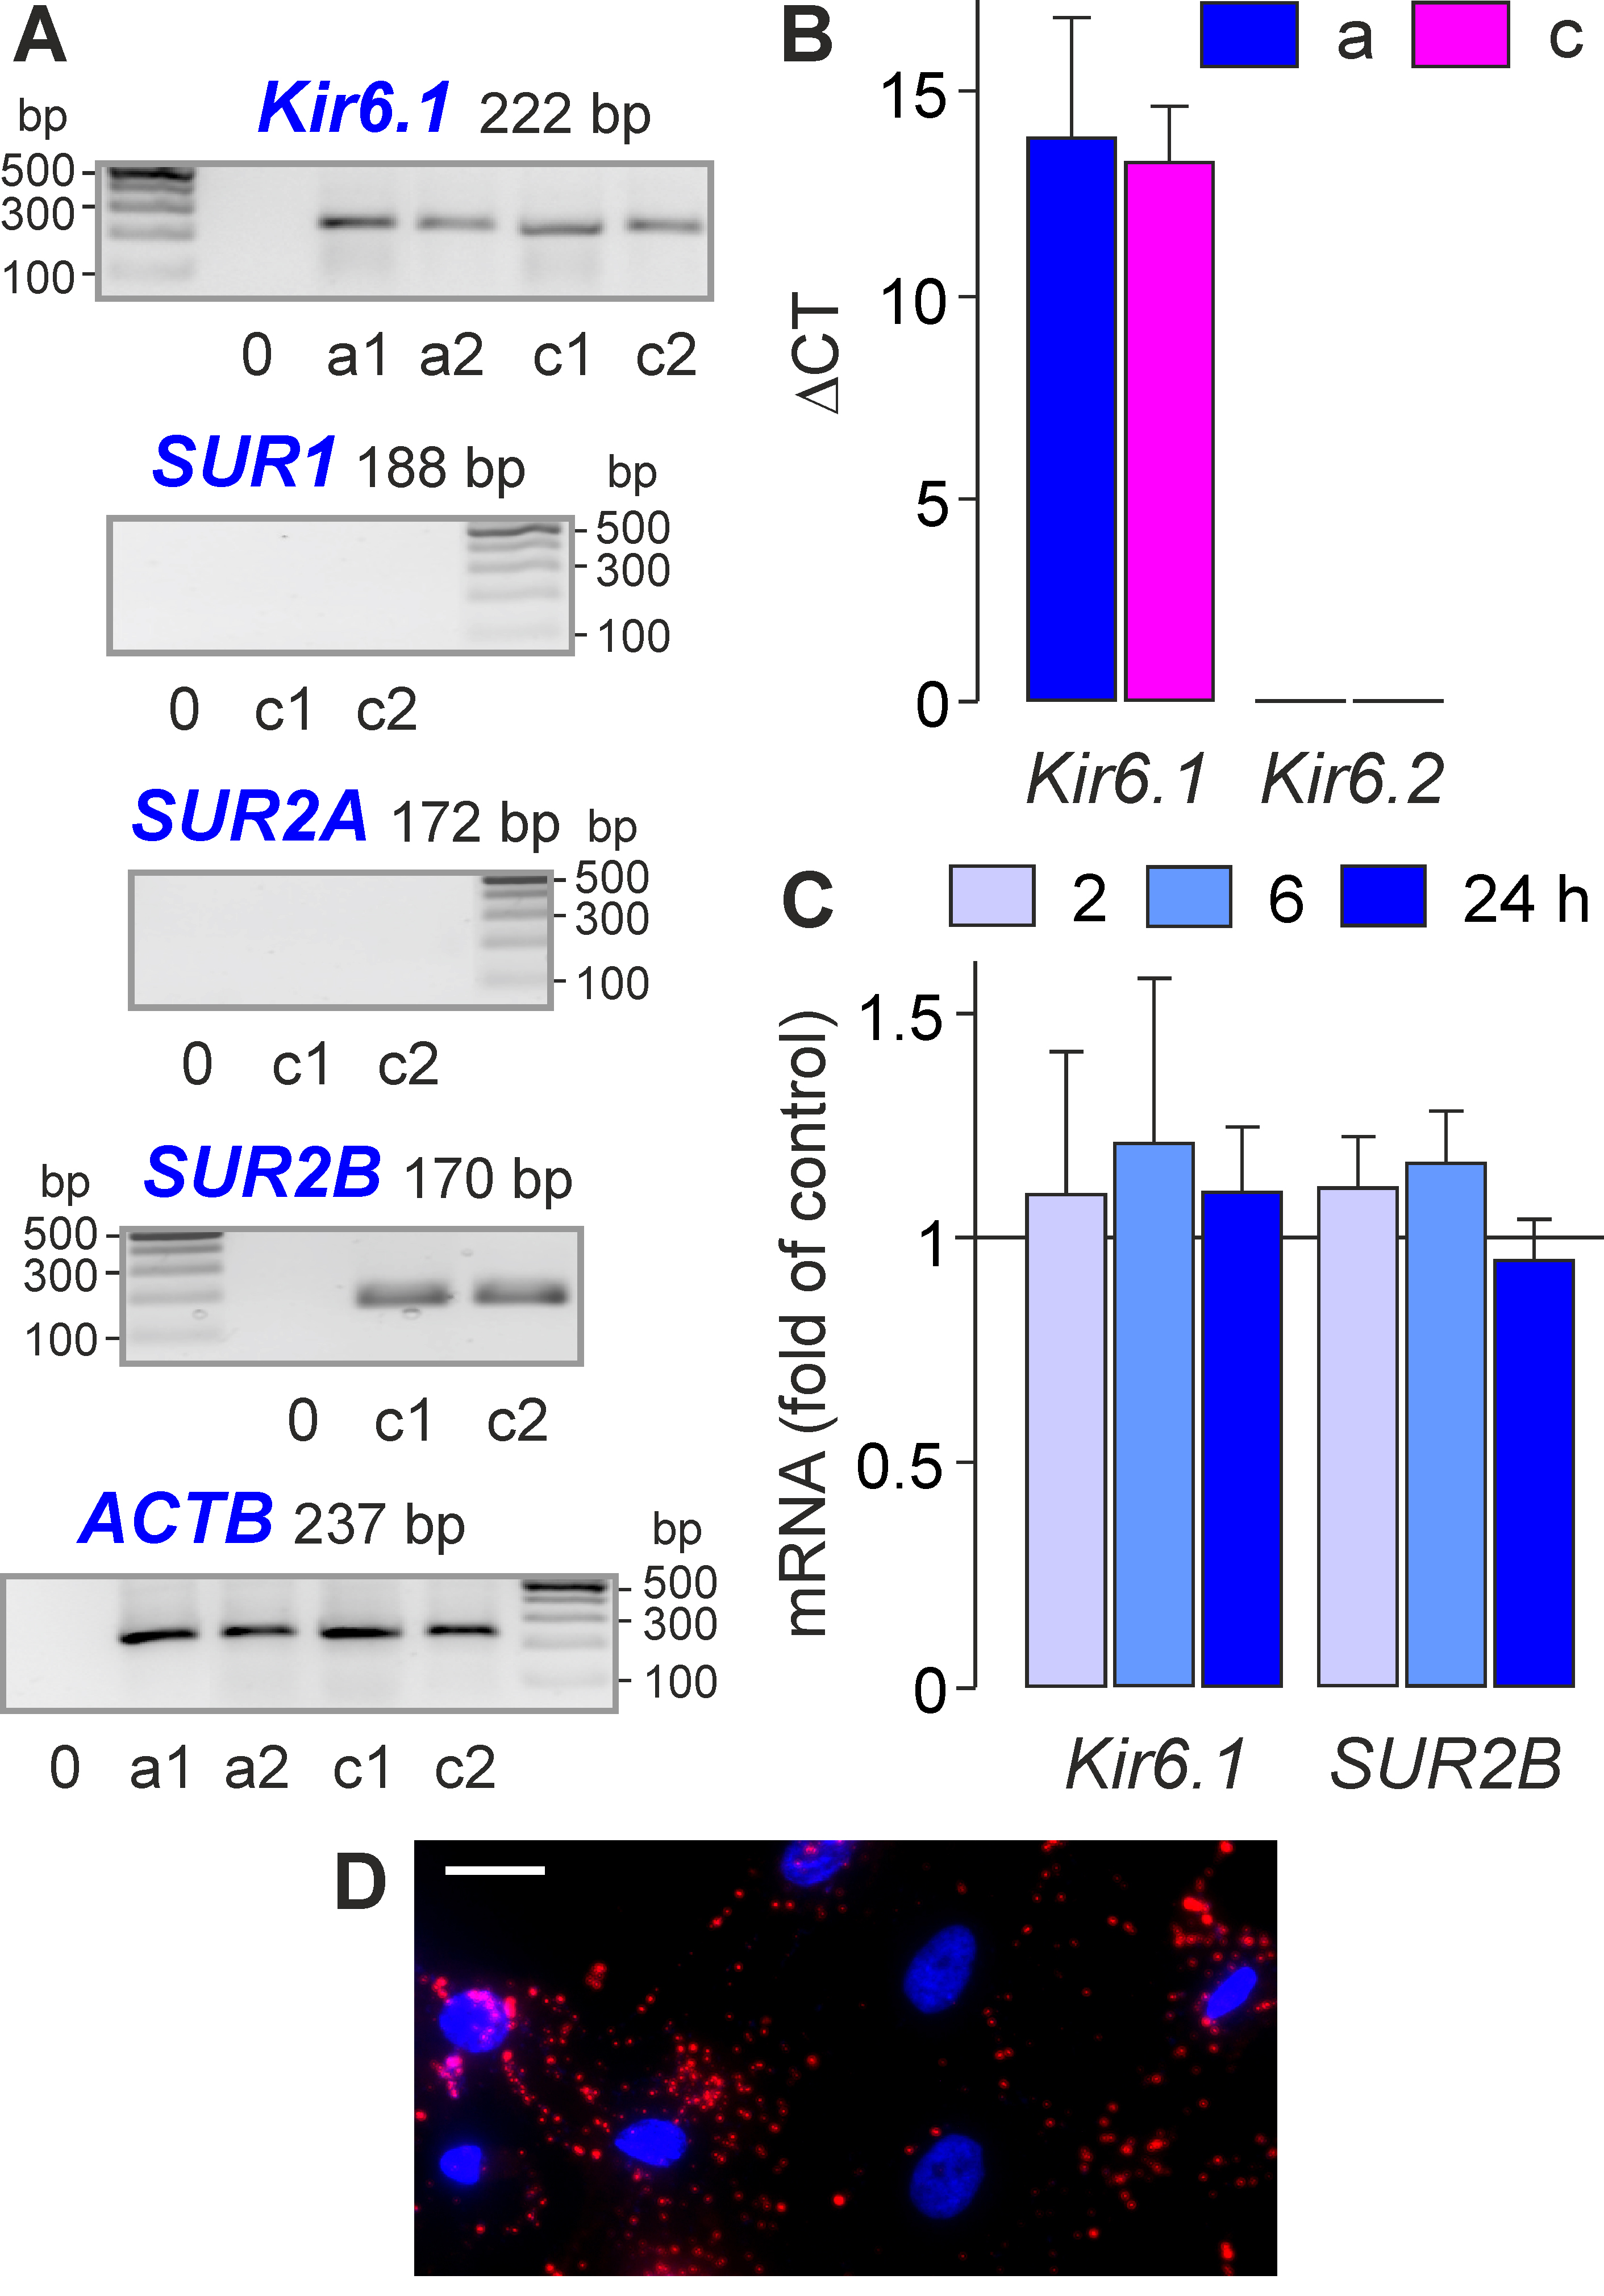
 Figure 7 of
Schnabel, Mol Vis 2020; 26:797-817.
Figure 7 of
Schnabel, Mol Vis 2020; 26:797-817.