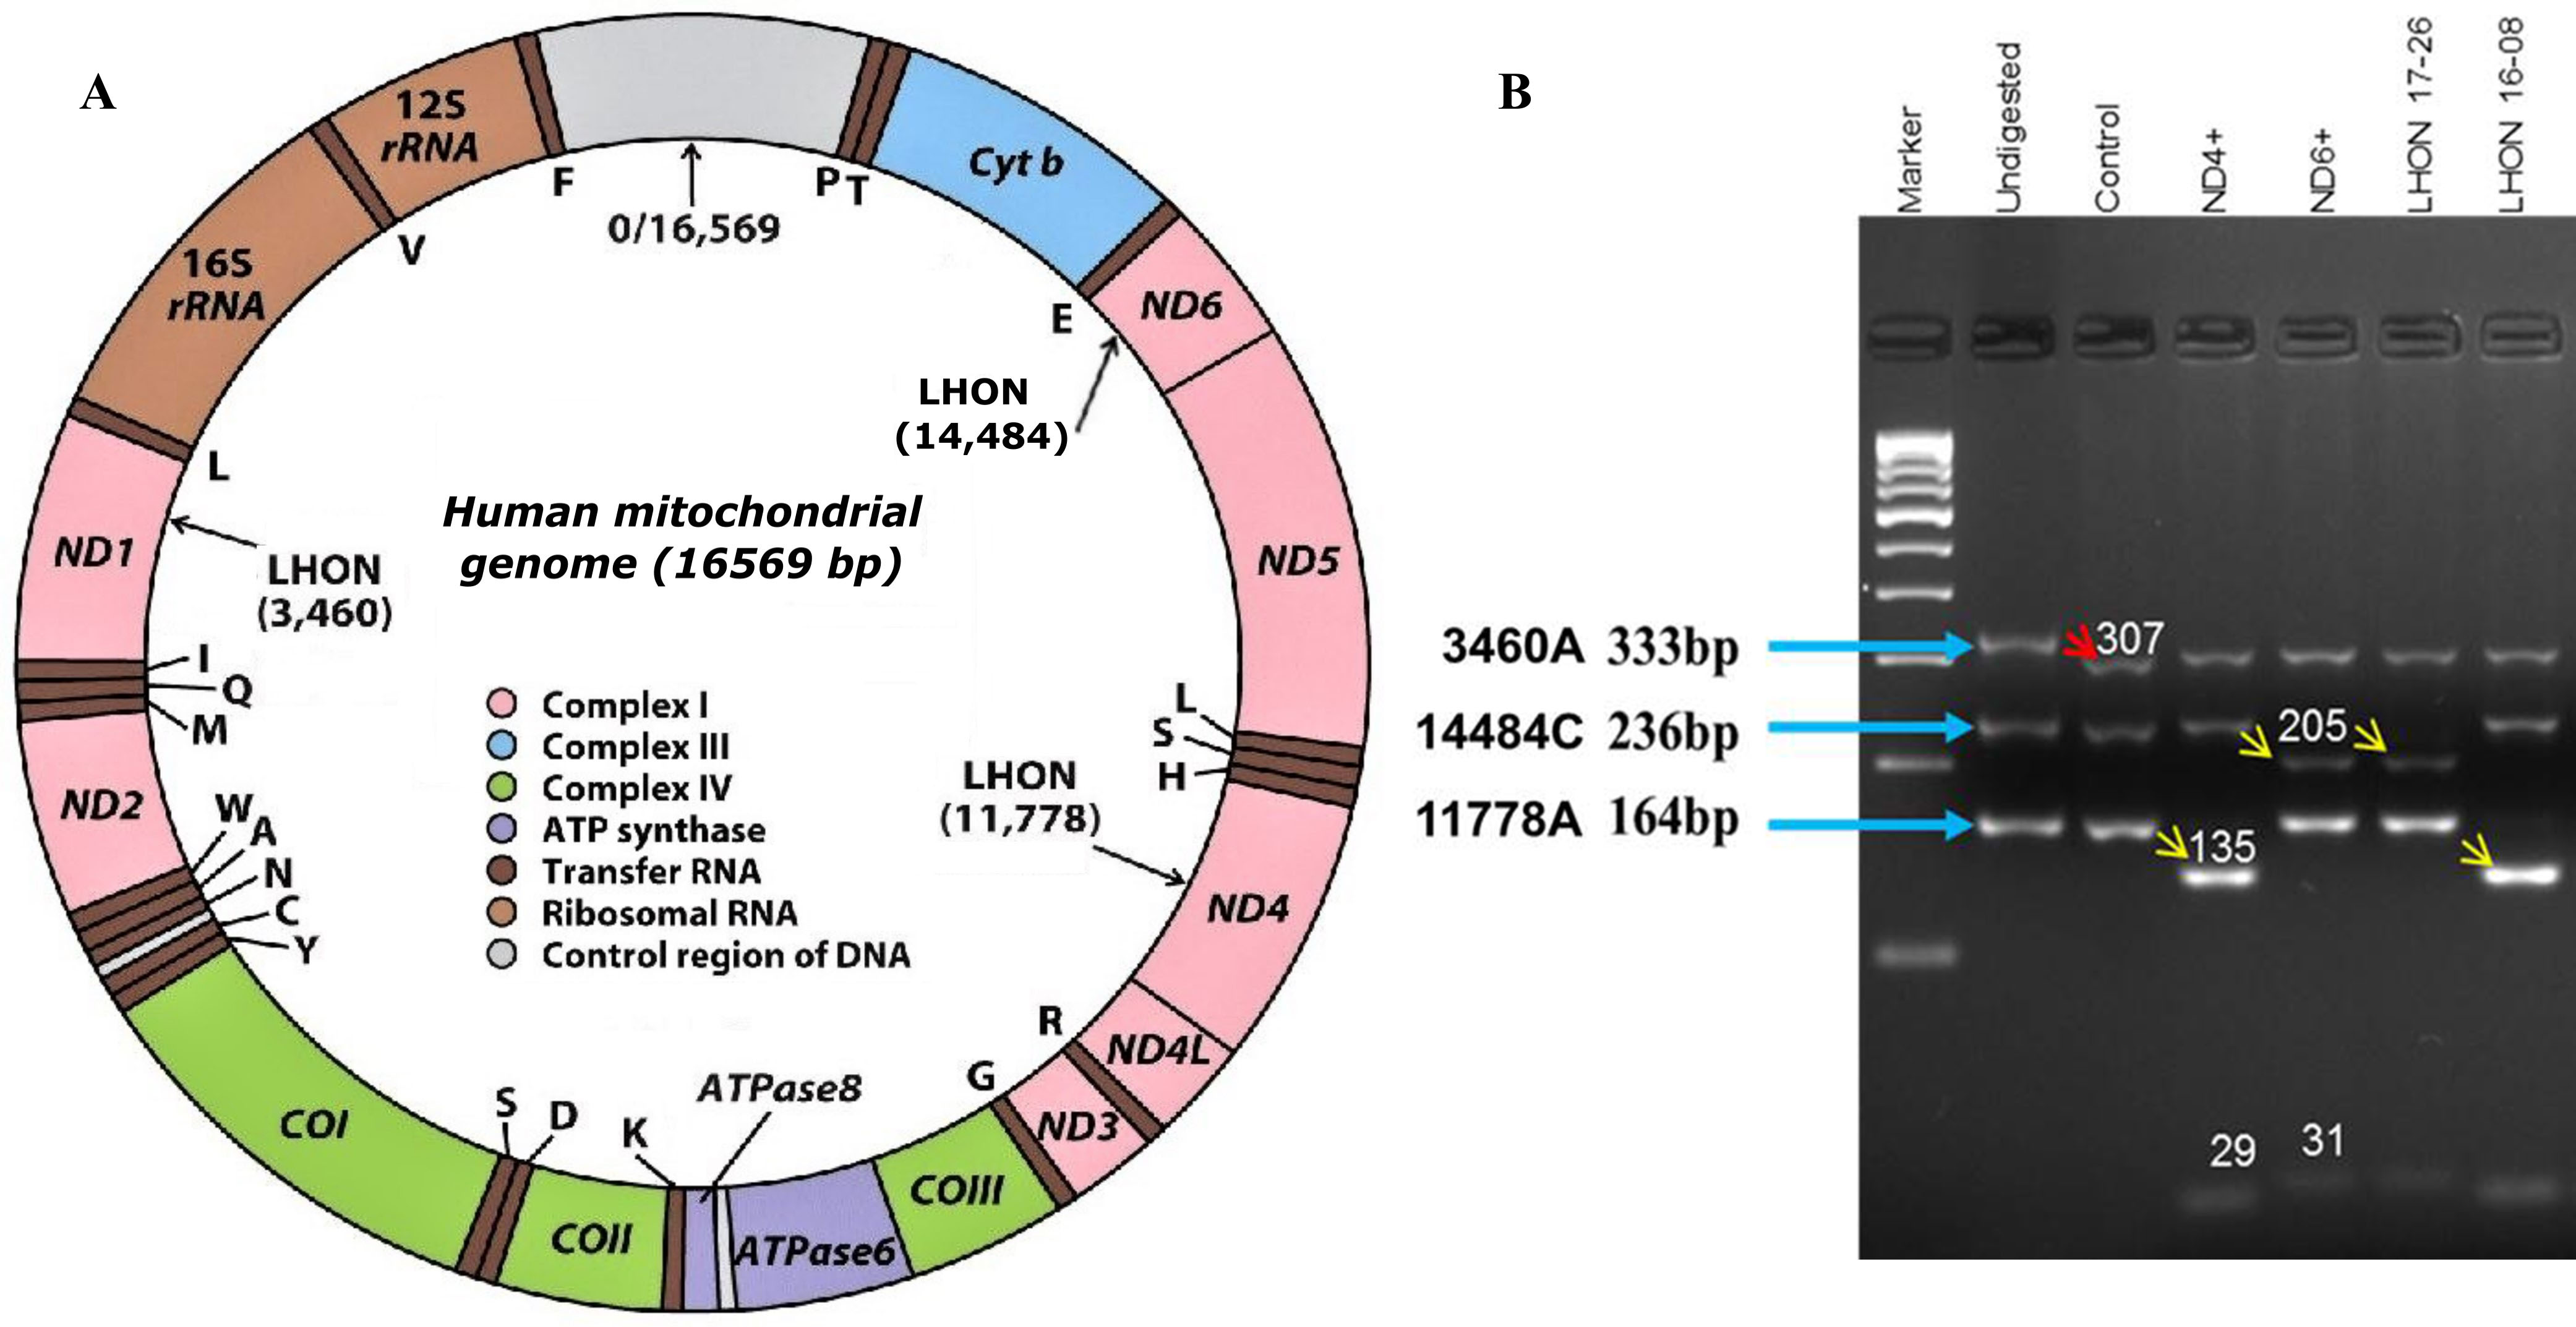
Figure 3. Human mitochondrial genome and detection of primary mutations in LHON samples.
A: Schematic representation of the human mtDNA map indicating 37 genes including MT-ND1, MT-ND4 and MT-ND6 as well as the positions
of primary mutations. Figure adapted from
chimerasthebooks.
B: The red arrow demonstrates the internal control of digestion in the
MT-ND1 gene product. The yellow arrows indicate the
MaeIII restriction, detecting the corresponding mutations marked in blue arrows.
 Figure 3 of
Gowri, Mol Vis 2020; 26:789-796.
Figure 3 of
Gowri, Mol Vis 2020; 26:789-796.